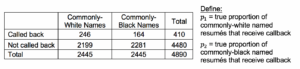
Recall the 2004 study by two University of Chicago economists who wanted to test for labor market discrimination. The results, which we analyzed in the last in-class activity, are summarized in the following table:
Question 1
In the previous in-class activity, we conducted a two-sample z-test for proportions to test if commonly-white names received a truly higher callback proportion than commonly-black names.
Write down the hypotheses we used for this test and write a brief explanation of what each hypothesis means:
Question 2
Recall that all the conditions for inference were met. The z-test statistic value was 4.23, and the P-value was very close to 0.
What conclusion can we draw from these results? State your conclusion in context. Use significance level [latex]\alpha = 0.05[/latex].
Question 3
Go to the DCMP Compare Two Population Proportions tool at https://dcmathpathways.shinyapps.io/2sample_prop/. Select the “Number of successes” option and input the relevant data from the study. Under the type of inference section, select “Confidence Interval” and a 95% confidence level.
- Part A: What is the confidence interval?
- Part B: What exactly is this interval estimating? One proportion? Two proportions? A combination of proportions? Explain.
- Part C: Interpret your interval in the context of the study.
Question 4
Look back at the hypotheses for your test and your conclusion. Then, look back at the confidence interval. Let’s compare these results.
- Part A: Do the values in your interval support the hypothesis (null or alternative) that your significance test also supported? Explain.
- Part B: If the interval contained the null value of 0, would it be consistent with the results of the significance test? Explain.
Confidence intervals contain a range of plausible estimates of the population parameter. We just considered the population parameter of the difference of proportions, [latex]p_{1} -p_{2}[/latex], but these results can extend to a confidence interval for any parameter, including one proportion, [latex]p[/latex].
The confidence intervals constructed in these activities were two-tailed, since z* is the point on the standard normal distribution such that the proportion of area under the curve between [latex]-z^{*}[/latex] and [latex]+z^{*}[/latex] is [latex]C[/latex], the confidence level.
The two-tailed confidence intervals with a confidence level of [latex]C[/latex] correspond to two-tailed hypothesis tests with a significance level of [latex]1-C[/latex].
For example, a 95% confidence interval corresponds to a hypothesis test with a significance level of 5%, or [latex]\alpha = 0.05[/latex]. Similarly, a 99% confidence interval corresponds to a hypothesis test with a significance level of 1%, or [latex]\alpha =0.01[/latex].
Question 5
Let’s connect these results to a one-sample test of proportions. Imagine you are a pollster. You randomly sample people in your county and ask them about their political leanings. Based on your sample, you create the following 95% confidence interval for the proportion of county voters who are Republican: (49%, 52%).
Imagine you also conduct a hypothesis test with the following hypotheses: *MISSING LATEX
- Part A: If you were to conduct the hypothesis test, would it be safe to reject the null hypothesis and conclude that there is significant evidence that the proportion of county voters that are Republican is 50%? Explain.
- Part B: In this context, which would provide more information: a hypothesis test or a confidence interval? Explain.
Question 6
Recall the vaping effects example in In-Class Activity 11.E. The National Institute on Drug Abuse was interested in the effects of the 2020 pandemic on drug abuse in teens. In particular, they were interested in the changes in vaping usage between the pre-pandemic period and three months into the pandemic.
Before the pandemic, 24% of 582 12th graders reported that they had vaped nicotine in the past 30 days. Three months into the pandemic, 17% of 582 12th graders reported that they had vaped nicotine in the past 30 days. Which of the following provides more information in this context? Explain.
- a) Hypothesis test:
The null hypothesis for the study was [latex]H_{0}: p =0.24[/latex] and the alternative hypothesis was [latex]H_{A}: p =0.24[/latex] . The test resulted in a P-value [latex]< 0.000[/latex] so we concluded there was sufficient evidence to conclude that the proportion of 12th graders who vaped within the last 30 days changed from the pre-pandemic period to three months into the pandemic.
- b) Confidence interval:
We are 95% confident that the true proportion of 12th graders who vaped within the last 30 days is between 0.1396 and 0.2006.
Typically, the conclusion drawn from a two-tailed confidence interval is usually the same as the conclusion drawn from a two-tailed hypothesis test. If a confidence interval contains the hypothesized parameter, a hypothesis test at the 0.05 level will almost always fail to reject the null hypothesis. If the 95% confidence interval does not contain the hypothesized parameter, a hypothesis test at the 0.05 level will almost always reject the null hypothesis. While this does not always hold for tests of proportions, a confidence interval typically provides more information about reasonable values of the parameter.
