Osteoporosis is a bone disease in which the bones in a person’s body have lost density, making them weak and brittle. The condition is most common in older women, and researchers have been searching for ways to treat and prevent osteoporosis for many years. In this in-class activity, we’ll use a simplified version of a real healthcare research study to explore the factors we consider when deciding if a one-way ANOVA is an appropriate test to use.
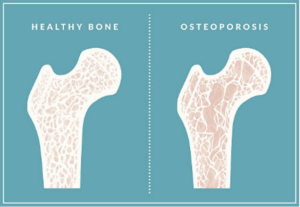
Credit: iStock/wetcake
Question 1
1) What are some different ways researchers could use an ANOVA to study osteoporosis?
Question 2
2) A 1995 study used a one-way ANOVA to compare different osteoporosis prevention strategies on the bone density of older women.1 The women were randomly assigned to receive either a placebo treatment, milk powder containing calcium, calcium pills, or calcium pills with an exercise program.
Part A: In your own words, identify the conditions/assumptions we need to consider before using an ANOVA.
Part B: What information do you need in order to know if this research study used an ANOVA appropriately? Explain.
1 Prince, R., Devine, A., Dick, I., Criddle, A., Kerr, D., Kent, N., Randell, A. & Price, R. (1995). The effects of calcium supplementation (milk powder or tablets) and exercise on bone density in postmenopausal women. Journal of Bone and Mineral Research, 10(7), 1068–1075.
Question 3
3) In order to compare the groups, the researchers measured the densities of the thigh bones for each of the treatment groups after a period of two years. Results were recorded as percentage changes in bone density from the beginning of the study. There were 168 participants in the study (42 in each group). The data provided in the following table (continued on the next page) are based on the summary statistics in the study presented in Question 2. The values represent the changes in bone density (%) for the patients within that group.
| Placebo | Milk | Calcium Pill | Calcium Pill Plus Exercise |
| -0.46 | -0.02 | -0.2 | 0.53 |
| -0.57 | -0.43 | -0.07 | 0.54 |
| -0.7 | -0.24 | -0.3 | 0.11 |
| -0.61 | 0.05 | -0.26 | 0.42 |
| -0.65 | -0.44 | -0.38 | 0.73 |
| -0.62 | -0.1 | 0.01 | 1.21 |
| -0.93 | -0.35 | -0.23 | 0.67 |
| -0.83 | -0.02 | 0.11 | 0.63 |
| -0.7 | -0.21 | 0.1 | 0.25 |
| -0.65 | 0.31 | 0.07 | 0.07 |
| -0.62 | -0.06 | -0.28 | 0.34 |
| -0.92 | -0.4 | -0.19 | 0.32 |
| -0.33 | -0.04 | 0.02 | 0.18 |
| -0.7 | -0.14 | -0.14 | -0.02 |
| -0.47 | -0.39 | -0.25 | 0.53 |
| -0.71 | 0.05 | -0.21 | 0 |
| -0.94 | -0.05 | 0 | 0.34 |
| -0.47 | 0.06 | -0.54 | 0.04 |
| -0.52 | -0.35 | -0.2 | 0.6 |
| -0.85 | -0.4 | -0.06 | 0 |
| -0.38 | -0.34 | -0.27 | 0.35 |
| -0.76 | -0.3 | 0.06 | -0.45 |
| -0.71 | -0.35 | -0.14 | -0.26 |
| -0.77 | -0.2 | -0.33 | 0.33 |
| -0.73 | -0.38 | -0.4 | -0.05 |
| -0.67 | -0.27 | -0.21 | -0.12 |
| -0.68 | 0.3 | -0.23 | 0.51 |
| -0.67 | -0.29 | -0.38 | 0.29 |
| -0.68 | -0.25 | -0.43 | 0.32 |
| -0.52 | -0.1 | -0.27 | 0.39 |
| -0.18 | -0.34 | 0.1 | 0.38 |
| -0.8 | -0.36 | -0.21 | -0.32 |
| -0.99 | -0.22 | -0.34 | 0.36 |
| -0.49 | -0.06 | -0.13 | 0.39 |
| -0.81 | -0.26 | -0.18 | 0.58 |
| -0.8 | -0.27 | 0 | -0.07 |
| -0.66 | 0.1 | -0.37 | 0.37 |
| -0.84 | 0.03 | 0.07 | 0.61 |
| -0.83 | -0.18 | 0.19 | 0.04 |
| -0.86 | -0.25 | -0.42 | 0.5 |
| -0.31 | -0.2 | -0.17 | -0.34 |
| -0.82 | -0.37 | -0.47 | 0.47 |
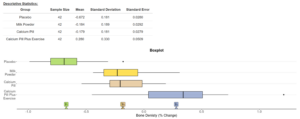
Part A: Based on this information, do you have any concerns about the type of data the researchers were testing with the one-way ANOVA? Explain.
Part B: The following are the descriptive statistics for each group. Based on this information, do you have any concerns about the variability of the groups in this ANOVA? Explain.
Part C: In this case, consider the experimental design. Do you have any concerns about how the groups were created? Explain.
Question 4
4) Write the null and alternative hypotheses for this ANOVA. Use statistical notation AND write out the hypotheses in the context of the problem.
Question 5
5) Go to the DCMP ANOVA: Analysis of Variance tool at https://dcmathpathways.shinyapps.io/ANOVA/. Under “From Textbook,” select “Osteoporosis.”
Part A: Write your F-statistic and P-value.
Part B: What is your interpretation of the P-value?
Question 6
6) Your elderly aunt asks, “What treatment works best to prevent osteoporosis?” Can you use the results of your ANOVA to answer her question? Explain.
Question 7
7) In this example, it is very tempting to make assumptions based on the obvious differences in the group means, but further testing is needed to confirm and provide statistical evidence of our conclusions. This testing will be the focus of our next in class activity.
Part A: As you prepare to start analyzing specific differences, what is one hypothesis you would like to test?
Part B: What other treatment options might be valuable for researchers to investigate?
