In the next preview assignment and in the next class, you will need to make decisions about the significance of the slope of a regression line.Carbon Dioxide and Global Temperature Anomaly Climate change and global warming occur when pollutants such as carbon dioxide (CO2) collect in the Earth’s atmosphere and absorb sunlight. These pollutants essentially trap heat instead of allowing it to escape into space and cause the planet to get warmer. This is known as the Greenhouse Effect, and for many years, scientists have looked at how CO2 emissions affect global temperature. When global temperature is measured, however, we look at what is known as the global temperature anomaly. This is the difference between the long-term average temperature and the actual temperature. A negative anomaly value indicates that the temperature is cooler than normal and a positive anomaly value indicates that the temperature is hotter than normal. (The last time the global temperature anomaly was recorded to be negative was over 40 years ago!)
Question 1
1) The linear model used to describe the relationship between CO2emissions and the global temperature anomaly is given by 𝑦̂=−0.382+0.0339𝑥where 𝑥is the amount of world CO2 emissions (in billion trillion tons) and the global temperature anomaly(𝑦)is in degrees Celsius.Alternatively, we can write the equation using a more convenient notation: Estimated Average Global Temperature Anomaly=−0.382+0.0339×Emissions
Part A: When the world CO2 emissions are 30 billion trillion tons, what is the estimated average global temperature anomaly? Include units in your answer.
Part B: When the world CO2 emissions are 31 billion trillion tons, what is the estimated average global temperature anomaly? Include units in your answer.
Part C: Between 30 and 31 billion trillion tons, did the estimated average temperature anomaly increase or decrease? By how much? Include units in your answer.
Part D: Which of the following statements best describes this situation?
a) When the amount of CO2 emissions increases by one billion trillion ton (one unit), the estimated average global temperature anomaly increases by 0.0339 degrees Celsius.
b) When the amount of CO2 emissions increases by one billion trillion ton (one unit), the estimated average global temperature anomaly decreases by 0.0339 degrees Celsius.The slope tells us how much the response variable changes, on average, for every one unit increase in the explanatory variable. We can use this information to determine what would happen if the explanatory variable were to increase by any number of units.
Part E: If the CO2emissions were to increase by two units instead of one unit, by how much would the average or expected global temperature anomaly change? Include units in your answer.
Part F: If the CO2emissions were to increase by five units instead of one unit, by how much would the temperature anomaly change? Include units in your answer. Park Attendance
Question 2
2) A theme park observes a random sample of days and records the high temperature and the park attendance for each day. A linear model is constructed and results in𝑦̂=12158+5.74𝑥 where 𝑦 is the number of people in attendance in the park and 𝑥 is the high temperature recorded in degrees Fahrenheit. Alternatively, we can express the model using more convenient variable names: Estimated Park Attendance=12158+5.74×Temperature
Part A: Using this linear model, when the high temperature is 70∘F, what is the estimated park attendance?
Part B: Using this linear model, when the high temperature is 105∘F, what is the estimated park attendance?
Part C: Circle the correct answer and then fill in the blank.Based on the given linear model, when the temperature increases by one degree, the park attendance will increase/decrease by _______ people, on average.
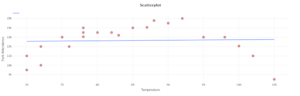
Part D: Based on the data collected, there were two days when the high temperature was 70∘F. On those days, the attendance was 9,500 and 11,000. On the day when the recorded high temperature was 105∘F, the park attendance was only 8,500. Based on following scatterplot of the data and your answers to Parts A and B, why do you think the predicted values are so different from the observed values?
Part E: Do you think using a linear model for prediction or inference is a good idea in this case? Explain.
