Earlier in this course, you learned how to conduct a one-way ANOVA for scenarios that involve comparing more than two groups. In this in-class activity, you’ll extend what you learned about ANOVA to a regression context. Using these new tools, you will consider the relationship between neighborhood income and organic food access.
Question 1
1) What was the purpose of the ANOVA table when comparing more than two groups?
Sum of Squares Total
[latex]\sum(y-\bar{y})^{2}[/latex]
Sum of Squares Regression
[latex]\sum(\hat{y}-\bar{y})^{2}[/latex]
Sum of Squares Residuals
[latex]\sum(y-\hat{y})^{2}[/latex]
In a regression context, the ANOVA table includes three different sums of squares: SSTotal, SSRegression, and SSResiduals.
Question 2
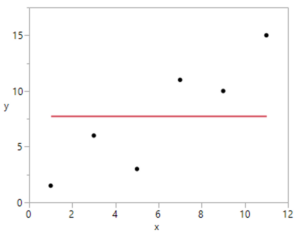
2) What does SSTotal measure? Mark the previous scatterplotsto show the deviations between the actual values of the response variable (𝑦)and the mean response (𝑦̅).
Question 3
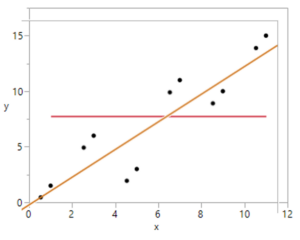
3) What does SSRegression measure? Mark the previous scatterplot to show the deviations between the predicted values of the response variable (𝑦̂)and the mean response (𝑦̅).
Question 4
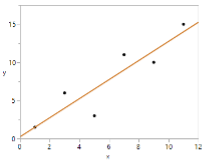
4) What does SSResiduals measure? Mark the previous scatterplot to show the deviations between the actual values of the response variable (𝑦)and the predicted values of the response variable (𝑦̂).
To better understand what each sum of squares measures, let’s imagine extreme scenarios where the sums of squares are equal to 0.
Question 5
5) Fill in the following table by sketching three scatterplots that satisfy the given criteria.
SSTotal = 0SSRegression = 0(but SSTotal ≠0)SSResiduals = 0(but SSTotal ≠0)
| SSTotal = 0 |
SSRegression = 0
(but SSTotal 0) |
SSResiduals = 0
(but SSTotal 0) |
|
|
|
|
An ANOVA is a way to “partition” the variation in the data. In other words, it divides the total variation into two parts: the part that is explained by the regression model (SSRegression) and the part that remains unexplained (SSResiduals).
𝑆𝑆𝑇𝑜𝑡𝑎𝑙=𝑆𝑆𝑅𝑒𝑔𝑟𝑒𝑠𝑠𝑖𝑜𝑛+𝑆𝑆𝑅𝑒𝑠𝑖𝑑𝑢𝑎𝑙𝑠
In In-Class Activity6.C, you learned that the coefficient of determination, 𝑅2, is interpreted as the percentage of variation in the response variable that can be explained by the linear relationship with an explanatory variable. This quantity can be expressed using the sums of squares. Note that 𝑅2can be expressed as a percentage or as a proportion.
[latex]𝑅^{2}=\frac{variation\;explained}{total\;variation}=\frac{SSRegression}{SSTotal}=1−\frac{SSResiduals}{SSTotal}[/latex]
Question 6
6) Revisit the extreme examples that you sketched in Question 5.
Part A: When SSRegression = 0, 𝑅2= _____.
Part B:When SSResiduals = 0, 𝑅2= _____.
Sums of squares can be organized in an ANOVA table. The following table provides the information necessary to calculate an F-statistic in the context of regression. Note that 𝑛=sample size and 𝑝=number of predictors. In simple linear regression, 𝑝=1.
A statistics student from San Antonio, Texas completed a project to explore whether there is a relationship between neighborhood income and access to organic items at local grocery stores. Specifically, the student counted the number of organic vegetables offered at 37 H.E.B. grocery stores. She then cross-referenced these data with the average household incomes(in dollars) for the zip codes where the stores are located.1
Question 7
7) Enter the grocery store data into the DCMP Linear Regression tool at https://dcmathpathways.shinyapps.io/LinearRegression/. Select “Average income in zip code”as the explanatory (𝑋) variable and “Number of organic items offered” as the response (𝑌) variable. Under “Regression Options,”click the box to show the ANOVA table. Use the information from the tool to fill out the following table.
| Source |
Df |
Sum sq |
Mean sq |
F value |
| Regression |
|
|
|
|
| Residuals |
|
|
|
|
| Total |
|
|
|
|
The ANOVA table will also include a P-value, which tells the probability of obtaining an F-statistic as large or larger than the one in the sample if the null hypothesis was true. An ANOVA F-test can be used to test the population slope for simple linear regression, the same scenario where you used a t-test in In-Class Activity16.A:1Scenario adapted from Skew the Script: https://skewthescript.org/3-1
[latex]H_{0}:\beta=0[/latex] vs. [latex]H_{A}:\beta\neq0[/latex], where [latex]\beta[/latex]=the population slope relating the number of organic items offered and the average income in zip codeTo model the values of the F-statistic that would occur if the null hypothesis was true and the assumptions for inference were met, you will use an F Distribution with 𝑑𝑓1=𝑝and 𝑑𝑓2=𝑛–1–𝑝.
Question 8
8) Use the DCMP F Distribution tool at https://dcmathpathways.shinyapps.io/FDist/to calculate a P-value that measures the evidence of an association between the number of organic items offered and the average household income. Include a sketch of the F Distribution.(You may assume that a linear model is appropriate and all assumptions for inference are met.)
Question 9
9) At the 𝛼=0.05significance level, do these data provide sufficient evidence of an association between the number of organic items offered and the average household income in the neighborhood? State your conclusion in context. Suppose you had conducted a t-test for the slope instead of an F-test for the slope in this scenario. The value of the t-statistic would have been 7.50, the square root of the F-statistic. The P-value for the two-sided t-test would be the same as the P-value for the F-test.
Question 10
10) As the F-statistic gets larger, the P-value gets smaller, indicating stronger evidence of an association. Answer Parts A through C to understand whichfactors affect the strength of evidence.
Part A: As the slope of the regression line gets steeper, the evidence of an association gets ______ (stronger/weaker).
Part B: As the spread of the points around the regression line increases, the evidence of an association gets ______ (stronger/weaker).
Part C: Assuming that the slope and the spread of the points around the regression line stay about the same, as the sample size increases, the evidence of an association gets ______ (stronger/weaker).