Question 1
1) What factors do you think determine high school students’ science test scores?
The dataset that we will be using in this in-class activity is called “High School and Beyond” and contains information about high school student achievement scores on math, science, reading, writing, and social studies tests. The dataset contains information about 200 high school students and 10 variables for each student. The data collected about each student includes the following: identification number, whether the student is male or female, race, socio-economic status, school type, program type, and scores from tests of reading, writing, math, science, and social studies. Descriptions of the variables are as follows:

Credit: iStock/Courtney Hale
| Variable name |
Definition |
| id |
Identification number of the student |
| female |
Gender of the student (0 = male, 1 = female) |
| race |
Ethnic background of the student (1 = Hispanic, 2 = Asian, 3 = Black, 4 = White) |
| ses |
Socio-economic status of the student (1 = low, 2 = medium, 3 = high) |
| schtyp |
School type (1 = public, 2 = private) |
| prog |
Program type (1 = general, 2 = academic preparatory, 3 = vocational/technical) |
| read |
Score from test of reading |
| write |
Score from test of writing |
| math |
Score from test of math |
| science |
Score from test of science |
| socst |
Score from test of social studies |
Questions 2–4: We are interested in answering the question,“Is there a relationship between science scores for high school students and math and reading scores?”
Question 2
2) Based on the question, what is the response variable? Identify the variable name from the dataset.
Question 3
3) What are the explanatory variables? Identify the variable names from the dataset.
Question 4
4) In simple linear regression, you have one response variable and one explanatory variable. Explain what the purpose of the simple linear regression model is.
Question 5
5) Using the following scatterplot of math and science scores, what do you notice about the relationship?
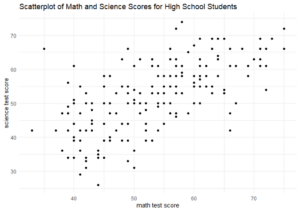
Question 6
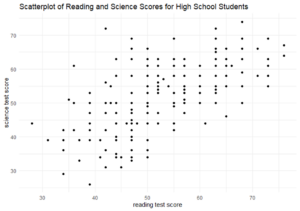
6) Using the scatterplot of reading and science scores, what do you notice about the relationship?
A linear regression model with two or more explanatory variables is called a multiple linear regression model. Since there is more than one explanatory variable, the model is no longer a line. In fact, we can include 𝑝 explanatory variables in our model. The equation for the estimated model that uses 𝑝 variables is
𝑦̂=𝑎+𝑏1∙𝑥1+𝑏2∙𝑥2+⋯+𝑏𝑝∙𝑥𝑝
where 𝑏1, 𝑏2, …, 𝑏𝑝 are the regression coefficients for explanatory variables 𝑥1, 𝑥2,…, 𝑥𝑝, respectively. In multiple linear regression, 𝑏1, 𝑏2, …, 𝑏𝑝 are called partial slopes.
Question 7
7) Using the following results, write the multiple linear regression equation for predicting science test scores using the explanatory variables of math and reading scores. Round the estimates to two decimal places.
|
Estimate |
| Intercept |
11.61550 |
| math |
0.4172 |
| read |
0.36542 |
We can interpret the regression coefficients for each explanatory variable in the model in terms of the relationship with the response variable. The explanation is very similar to what we have seen in simple linear regression models. However, since it is a partial slope, we have to make sure that we hold any other explanatory variables constant in our interpretation. For example, for the following regression equation,
𝑦̂=𝑎+𝑏1∙𝑥1+𝑏2∙𝑥2+⋯+𝑏𝑝∙𝑥𝑝
the partial slope, 𝑏1, represents the expected change in the response variable, 𝑦, for every one unit increase in 𝑥1, holding explanatory variables 𝑥1, 𝑥2, …, 𝑥𝑝 constant.
Question 8
8) What is the interpretation of the coefficient for the explanatory variable of mathscoresin the context of the dataset?
The coefficient of determination, 𝑅2, is used to determine the percentage of variability in the response variable that is accounted for by the explanatory variables. In this activity, we will call the value the unadjusted 𝑅2. In simple linear regression, we would interpret the 𝑅2 value as the percentage of the variation in the response variable that can be explained by the linear relationship with the explanatory variable. For multiple linear regression, the interpretation is similar, but now the variation in the response variable is explained by the linear relationship with multiple explanatory variables.
Question 9
9) The unadjusted 𝑅2 value for this model is 0.4782. Interpret the unadjusted value of𝑅2for this model.
Question 10
10) The simple linear regression model with math alone has an 𝑅2value of 39.8%.The simple linear regression model with reading alone has an 𝑅2 value of 39.7%. Explain why the total amount of variability explained by the model is not: 39.8% +39.7% =79.5%
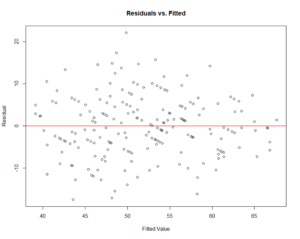
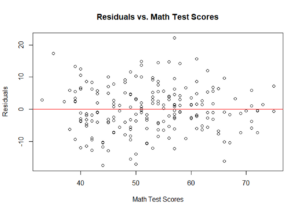
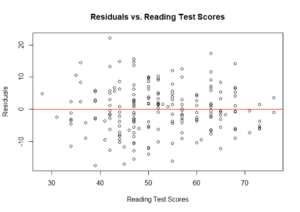
We can assess whether or not it is reasonable to fit a linear regression model using residual plots, similar to simple linear regression. In multiple linear regression, the y-axis has the residual values and the x-axis has the explanatory variables and/or the fitted values. For a multiple linear regression model, you create a residual plot for each continuous explanatory variable, as well as the fitted value.We would expect to see the residual values appear randomly scattered across the x-values with no clear patterns(e.g., residual plots that display a curvature violate the linearity condition). Residual plots that increase or decrease in magnitude (distance from zero) violate the constant variance condition. The residual plot of the residuals vs. predicted values account for all the variables in the model. Residual plots of the residuals vs. individual exploratory variables allow us to identify a potential source of a violation. The normality condition is beyond the scope of this course.
Question 11
11) Looking atthethreeresidual plotsthat follow,is it reasonable to fit a linear regression model to thesedata? Explain.