Question 1
1) Considerthe “High School and Beyond”dataset. What is anadditional explanatory variable (that is categorical)thatmight be related to science test scores?
In this in-class activity, we will continue using the “High School and Beyond”dataset we saw in In-Class Activity 17.A. Recall that the dataset contains information about high school student achievement scores on math, science, reading, writing, and social studies tests. The dataset contains information about 200 high school students and 10 variables for each student. Descriptions of the variables are as follows:

Credit: iStock/Courtney Hale
| Variable name |
Definition |
| id |
Identification number of the student |
| female |
Gender of the student (0 = male, 1 = female) |
| race |
Ethnic background of the student (1 = Hispanic, 2 = Asian, 3 = Black, 4 = White) |
| ses |
Socio-economic status of the student (1 = low, 2 = medium, 3 = high) |
| schtyp |
School type (1 = public, 2 = private) |
| prog |
Program type (1 = general, 2 = academic preparatory, 3 = vocational/technical) |
| read |
Score from test of reading |
| write |
Score from test of writing |
| math |
Score from test of math |
| science |
Score from test of science |
| socst |
Score from test of social studies |
Questions 2–5: We are interested in building a prediction model that will allow us to predict science test scores based on math test scores and recorded gender.
Question 2
2) What is the response variable? Identify the variable name from the dataset.
Question 3
3) What are the explanatory variables? Identify the variable names from the dataset.
Question 4
4) What type of variables are the explanatory variables?
Question 5
5) How many levels do the categorical explanatory variables have? What are the levels? How can we incorporate a categorical variable like gender into a regression equation?
This is done by using an indicator variable for the categorical variable and then using that variable in fitting the linear regression model. An indicator variable is a binary variable with only two values: 0 and 1. When creating an indicator variable, we assign the value of1 for a certain category, and the value of 0 is used for all other categories. An example of an indicator variable is the variable schtyp in the dataset about the school typeof the students. For the variable schtyp, the value of 1 indicates that the student attends a public school and the value of 2 indicates that the student attends a private school.
Question 6
6) Let’s practice creating an indicator variable of 0 and 1 values for the categorical variable schtyp using observations from the dataset.
Part A: Let’s define a new indicator variable called public. We often give convenient names to indicator variables The variable publicis equal to 1 when the school type is public and 0 for otherwise. What would be the valueof each levelfor the indicator variable?
Part B: Fill in the appropriate values in the following table for the indicator variablepublic.
| id |
schtyp |
Indicator variable (public) |
| 30 |
1 |
|
| 31 |
2 |
|
| 32 |
1 |
|
| 33 |
1 |
|
| 34 |
2 |
|
If there are 𝑘 levels of a categorical variable, we can create 𝑘−1indicator variables to define our regression model. We use an indicator variable for a categorical variable in order to clarify which category we want as our reference group for the model equation. A reference group is the value of the categorical variable that is not represented explicitly by the indicator variable (which is why we only require 𝑘−1indicator variables to define our regression model). For example, the reference group for the indicator variable public=0 is the category indicating private school students. Recall that we are interested in building a prediction model that will allow us to predict science test scores based on math test scores and gender. After creating the indicator variable, our model will have math test scores and the indicator variable female as the explanatory variables.
Question 7
7) Using the following output from a multiple linear regression model, write the multiple linear regression equation for predicting science test scores using the explanatory variables of math and gender.
| Coefficients |
Estimate |
| Intercept |
18.12 |
| math |
0.66 |
| female – indicator variable (1 = female)* |
2.16 |
*Reference category is 0, which means male
Question 8
8) When interpreting the slope of an indicator variable, do you think it is appropriate to say “for each one-unit increase?” Explain. Hint: What does a one-unit increase mean in the context of an indicator variable? Is that meaningful?
In the additive model used (a non-additive model will be discussed inIn-Class Activity17.C), the regression coefficient for an indicator variable is the average difference in the explanatory variable compared to the reference group(the group for whom the indicator variable is equal to 0, holding all other explanatory variables constant).
Question 9
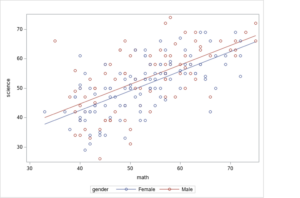
9) The following figure visualizes the fitted regression model. What features do you notice?
Question 10
10) What is the interpretation of the slope for the explanatory variable of the indicator variable (female) in the context of the dataset?
Question 11
11) Does there appear to be a difference in the expected science scores for male and female students, controlling for math scores? Explain.
