In the preview assignment, you revisited the one-sample t confidence interval for a population mean and the conditions that must be met for it to be an appropriate method for estimating a population mean. In this in-class activity, we will learn about a new method for estimating a population mean that is appropriate even when the conditions for at confidence interval are not met.In the preview assignment, the idea of measuring the fuel efficiency of electric cars using the kWh/100 miles rating(kWh stands for kilowatt hours)was introduced. This rating is the number of kWh of electricity needed for an electric car to travel 100 miles.

Credit: iStock/Vladimir Vladimirov
Question 1
1) What does it mean if an electric car has a kWh/100 miles rating of 40?
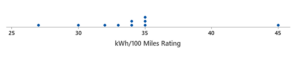
In the preview assignment, data on the kWh/100 miles ratings for a random sample of 10 electric cars (2021 models) were given. A dotplot of the sample data is shown here:
Question 2
2) Woulditbe appropriate to use the sample data to estimate the mean kWh/100 miles rating for all 2021 electric cars using a one-sample t confidence interval?Justify your answer based on the dotplot.
Fortunately, even though the conditions for a one-sample t confidence interval are not met, there is another method that can be used to get a confidence interval for the population mean. This new type of interval is called a bootstrap confidence interval.
Bootstrap Distributions
The t confidence interval is constructed by creating an interval around the observed sample mean by adding and subtracting a number to get the endpoints of the confidence interval. The number that is added and subtracted depends on certain conditions being met and is based on the standard deviation of the sample mean and the t Distribution. Bootstrapping is a way to figure out what number should be added to the sample mean and what number should be subtracted from the sample mean if we can’t rely on the t Distribution. What we do is sample from a hypothetical population that we think will be very similar to the population that our sample is from. Seeing what happens when we sample from this hypothetical population gives us the information that we need to determine the endpoints of a reasonable confidence interval.If we assume that our sample is representative of the population, the hypothetical population that we would be thinking of would be one that has the same values as our sample but that is much larger than the sample. For example, if one of the observations in our sample was 30, we would think that there were probably many individuals in the population that had a value of 30. This is why when we create a bootstrap sample, we sample with replacement. This is equivalent to sampling from the larger hypothetical population that we think is similar to the population we are actually interested in. The bootstrap distribution for a sample mean is formed by looking at sample means from a large number of different bootstrap samples.
Question 3
3) Recall from the preview assignment that a bootstrap sample is just a sample that is selected with replacement from the values in the original sample and that has the same sample size as the original sample.
Part A: In the preview assignment, you selected two bootstrap samples from the sample of kWh/100 miles ratings. What were the sample means for your two bootstrap samples?
Part B: Working with the other students in your class, create a class dotplot that includes all the bootstrap sample means for the entire class.
Part C: The mean of the original sample is 34 kWh/100 miles. What do you notice about the class dotplot of bootstrap sample means?Does the distribution of bootstrap sample means appear to be symmetric? Explain.
To create a bootstrap distribution, we want to take a large number of bootstrap samples. So, we turn to technology. A statistics software package was used to create the following histogram of the bootstrap distribution based on 1,000 bootstrap samples: The bootstrap distribution is used to obtain a confidence interval for the population mean. Notice that the bootstrap distribution is centered at 34, which was the sample mean of the original sample. For a 95% confidence level, using the boundaries that capture the middle 95% of the bootstrap distribution to determine the endpoints of the confidence interval is equivalent to adding a number to the original sample mean and subtracting a number from the original sample mean. For a bootstrap confidence interval, the number that is added and the number that is subtracted are not the same because the bootstrap distribution is not symmetric.
Question 4
4) The following graph shows the bootstrap distribution with boundaries marked that separate the middle 95% of the bootstrap sample means from the smallest 2.5% and the largest 2.5%. The bootstrap confidence interval has a lower endpoint of 31.6 and an upper endpoint of 37.2.
Part A: How would you interpret this interval?
Part B: What would change if you wanted to find a 90% confidence interval instead of a 95% confidence interval? Would a 90% interval be narrower or wider than the given 95% confidence interval? Explain.
Question 5
5) To calculate a bootstrap confidence interval, we can use the app athttps://istats.shinyapps.io/Boot1samp/.•For the “Enter Data” option, choose “Your Own.”•Type the values from the sample into the “Enter Observations” box. Separate the data values by spaces or commas.•The values for the sample are: 45, 35, 27, 34, 35, 35, 32, 33, 34, and 30.•For the “Statistic of Interest” option, select “Mean.” The left-handside of the display should look like this: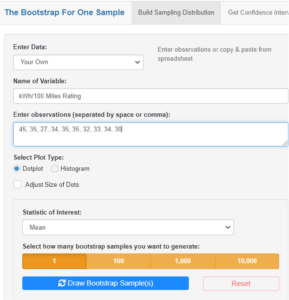 On the left-handside of the display, under “Select how many bootstrap samples you want to generate,”click on “1,000.”Then,click on “Draw Bootstrap Sample(s).” When you have completed this step, you should see the bootstrap distribution in the lower part of the right-hand side of the display.
On the left-handside of the display, under “Select how many bootstrap samples you want to generate,”click on “1,000.”Then,click on “Draw Bootstrap Sample(s).” When you have completed this step, you should see the bootstrap distribution in the lower part of the right-hand side of the display.Part A: Is the bootstrap distribution symmetric or skewed?
Part B: Once the bootstrap distribution has been prepared, it is possible to calculate a bootstrap confidence interval. At the very top of the display, click on the Get Confidence Intervaltab. Check to make sure that the confidence level is setto 95%. You should see the corresponding bootstrap confidence interval on the right-handside of the display. What did you get for the 95% confidence interval?
Part C: The 95% bootstrap confidence interval based on the output given in Question 4 was (31.6, 37.2). Did you get the same interval when you used the app? Is it surprising that the intervals might be a little different?
Part D: Use the app to construct a 99% confidence interval for the mean kWh/100 miles rating for electric car models made in 2021.
Part E: What is the advantage of using a bootstrap confidence interval to estimate the mean kWh/100 miles rating using this sample of size 10?
