Preparing for the next class
In the next in-class activity, you will need to create a bootstrap confidence interval for a population median and determine when it is appropriate to use a two-sample t confidence interval to estimate a difference in means. We have seen how to construct and interpret a bootstrap confidence interval for a population mean. The next in-class activity will extend bootstrap confidence intervals in two ways. We will consider how to construct bootstrap confidence intervals for population parameters other than the mean (including the median and the standard deviation). We will also see bootstrap confidence intervals for a difference in population means.
Question 1
1) In the previous in-class activity, a bootstrap confidence interval for a population mean was constructed by using percentiles from a bootstrap distribution formedby calculating the value of the sample mean for a large number of bootstrap samples. But what if we wanted to get a confidence interval for a different population parameter? For example, maybe a population distribution is quite skewed,so the median might be a better choice for describing the center of the distribution. Could we use sample data to calculate a confidence interval for the population median? There is no t confidence interval or z confidence interval for a population median.In the previous in-class activity, we were able to use sample data to construct a bootstrap confidence interval for a population mean by carrying out the following steps:
1. Create a bootstrap sample by selecting a sample with replacement from theoriginalsample.
2. Calculate the sample mean for the bootstrap sample.
3. Repeat Steps 1 and 2 a large number of times.
4. Createa bootstrap distribution of the bootstrap sample means and thendetermine the end points of the confidenceinterval by using appropriatepercentiles of the bootstrap distribution.
Part A: How could this procedure be modified to create a bootstrap confidence interval for a population median instead of a population mean?
Part B: Do you think that this same process could be used for other populationparameters, like the population standard deviation or the population interquartile range?
Do dogs prefer petting or verbal praise? Researchers at the University of Florida collected data to try to answer this question.[1] They measured the amount of time a dog spent interacting with its owner during a five-minute period while the owner was offering petting for a sample of seven adult dogs. They also measured the amount of time a dog spent interacting with its owner during a five-minute period while the owner was offering verbal praise for a sample of seven adult dogs.
Question 2
2) We will assume that each of the two samples of dogs are representative of the population of all adult dogs and that the samples were independently selected.
Part A: How many sampleswere there in the study described?
Part B: The data for the two samples and the corresponding dotplots are given as follows. Time spent was measured in seconds.
| Petting | 114 | 203 | 217 | 254 | 256 | 284 | 296 |
| Vocal praise | 4 | 7 | 24 | 25 | 48 | 71 | 294 |
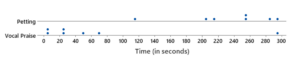 Does it look like there is a difference in the amount of time that dogs spend interacting with their owners when being petted compared to being given verbal praise?
Part C: What are the assumptions for the two-sample t confidence interval?
Part D: Would it be appropriateto use a two-sample t confidence interval to estimate the difference in mean time spent interacting for dogs being offered pettingand dogs being offered verbal praise? Explain.
- Feuerbacher, E. N. & Wynne, C. D. (2015). Shut up and pet me! Domestic dogs(canis lupus familiaris)prefer petting to vocal praise in concurrent and single-alternative choice procedures.Behavioural Processes, 110, 47–59. ↵
