Question 1
According to the Centers for Disease Control and Prevention (CDC), without protection from the sun’s ultraviolet (UV) rays, damage can be done to your skin in as little as 15 minutes. Over time, this damage can increase the risk of developing skin cancer; thus, it is important to always practice “sun safety,” such as wearing sunscreen and sunglasses and taking breaks in the shade.[1]
As part of the National College Health Assessment[2] survey, researchers asked a random sample of college students:
- When you are outdoors in the sun, how often do you wear sunscreen?
- When you are outdoors in the sun, how often do you wear sunglasses to protect yourself from UV exposure?

Credit: iStock/grafxart8888
- If you had to guess, what proportion of college students do you think always wear sunscreen while outdoors in the sun?
- What proportion of college students do you think always wear sunglasses to protect themselves from UV rays?
Question 2
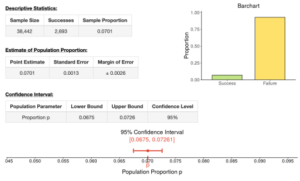
Out of 38,442 responses, 2,693 college students stated that they always wear sunscreen when they are outside in the sun.
The printout below contains the results from the DCMP Inference for a Population Proportion tool. The number of “Successes” refers to the 2,693 college students who stated they always wear sunscreen.
- When constructing confidence intervals for a proportion, remember that it is important to first confirm that the following conditions are met:
- Random sampling is used.
- The sample is less than 10% of the population.
- The sample is large enough that [latex]n\hat{p} \geq 10[/latex] and [latex]n(1 − \hat{p}) \geq 10[/latex].Although it is not specified above, we can assume that the sample is less than 10% of the population.
Confirm that the other two conditions are met.
- Using the previous results from the DCMP Data Analysis Tool, identify the point-estimate, standard error, margin of error, confidence level, and lower and upper bounds of the confidence interval for estimating the population proportion of American college students who always wear sunscreen while outdoors in the sun. Complete the following table.
Point-Estimate Standard Error Margin of Error Confidence Level Lower Bound Upper Bound - A friend reads the output and interprets the confidence interval as the following:“There is a 95% chance that the population proportion of college students who always wear sunscreen is between 0.0675 and 0.07261, or 6.75% and 7.261%.”
Is this a correct interpretation of the confidence interval? Explain. If it is not a correct interpretation, what is the correct interpretation?
- As part of their Healthy People 2020 initiative, the CDC set a target goal of increasing the percentage of young people who regularly wear sunscreen to 11.2%. Given the calculated confidence interval and its correct interpretation, does it appear the proportion of college students who always wear sunscreen hits this goal?
Question 3
Out of 38,281 responses, 5,954 college students stated that they always wear sunglasses to protect themselves from UV rays.
- Use the tool (https://dcmathpathways.shinyapps.io/Inference_prop/) to calculate a 95% confidence interval for estimating the population proportion of college students who always wear sunglasses to protect themselves from UV rays.
- Under the “Enter Data” drop-down menu, select “Number of Successes.”
- Enter 38,281 as the sample size and 5,954 as the number of successes.
- Complete the following table with the appropriate calculations from the output.
Point-Estimate Standard Error Margin of Error Confidence Level Lower Bound Upper Bound
- Interpret the 95% confidence interval that you constructed.
- Using the same previous figure from the CDC (i.e., 11.2%), does it appear more than 11.2% of college students always wear sunglasses to protect themselves from UV rays? Explain.
- Without using the DCMP Data Analysis Tool or a calculator, determine whether a 99% confidence interval calculated from these sample data would result in a narrower or wider interval. Explain.
Question 4
Reflect back on your responses to Question 1. Do the confidence intervals you constructed in Questions 2 and 3 align with your initial guesses? Explain.
- Centers for Disease Control and Prevention. (2018, December 13). Sun exposure. https://wwwnc.cdc.gov/travel/page/sun-exposure ↵
- American College Health Association-National College Health Assessment. (2020). Undergraduate student reference group data report, Fall 2019. https://www.acha.org/NCHA/ACHA NCHA_Data/Publications_and_Reports/NCHA/Data/Reports_ACHA-NCHAIII.aspx ↵
