Preparing for the next class
In the next in-class activity, you will need to identify the components of a confidence interval from a summary provided by the DCMP Inference for a Population Proportion tool. You will also need to construct confidence intervals with technology and interpret their meaning.
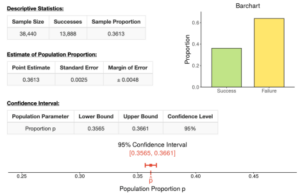
In In-Class Activity 8.B, we explored data from a national survey of college students conducted by the American College Health Association. One of the questions posed to the participants was, “On how many of the last 7 days did you take a nap?” Out of the 38,440 participants, 13,888 stated they had not taken a nap in the last 7 days.
The image below shows the results of calculating a confidence interval to estimate the population proportion of college students who have not had a nap in the last 7 days.
Question 1
Given the previous calculations shown, which of the following is the point-estimate for the proportion of college students who have not had a nap in the last 7 days?
- 0.3613
- 0.0025
- 0.3565
- 0.3565
Hint: The point-estimate is the proportion calculated from our sample.
Question 2
Which of the following confidence levels was used to calculate the confidence interval presented in the previous image?
- 90%
- 95%
- 99%
- It is impossible to know.
Question 3
Given the calculations shown, identify the lower bound and upper bound of the calculated confidence interval.
| Lower bound | Upper bound |
Accurately interpreting a confidence interval is just as important as ensuring our calculations are correct. One common but incorrect interpretation is that the confidence level is the probability (expressed as a percentage) that the population proportion is contained within the bounds of our confidence interval.
For example, using the confidence interval calculated previously, a student might incorrectly state:
“There is a 95% chance that the population proportion of college students who have not had a nap in the last 7 days is between 0.3565 and 0.3661, or 35.65% and 36.61%.”
Rather than measuring the likelihood that a single confidence interval contains the population proportion, the confidence level instead tells us the percentage of all confidence intervals that we’d expect to contain the population proportion, if we were to repeatedly take random samples and construct confidence intervals around our point estimates.
Let’s explore this idea a bit more.
Question 4
Suppose we knew that the population proportion of college students who did not take a nap in the last week was 0.40, or 40%. Of course, in reality we wouldn’t know the population proportion,—which is why we’re creating a confidence interval to begin with—but let’s assume that we did.
Now suppose we took 10 random samples of 100 college students and constructed a 95% confidence interval for each one. We can run this simulation using the DCMP Explore Coverage and Confidence Intervals tool available at
https://dcmathpathways.shinyapps.io/ExploreCoverage/.
The following picture illustrates a simulated result of this situation using the tool (i.e., 10 confidence intervals constructed from our 10 random samples).
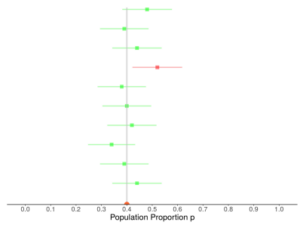
- The red lines in the previous picture represent the confidence intervals that did not contain the population proportion 0.40. Out of the 10 confidence intervals from this simulated result, how many of them did not contain the population proportion 0.40?
Hint: The red lines are those that did not contain the population proportion—how many red lines are in the previous picture? - The green lines in the previous picture represent the confidence intervals that did contain the population proportion that we assumed (0.40). Out of the 10 confidence intervals from this simulated result, how many of them did contain the population proportion 0.40?
Hint: The green lines are those that actually did contain the population proportion— how many green lines are in the previous picture?
- Given your answers to Parts a and b, what proportion of the 10 confidence intervals did contain the population proportion 0.40? What is this value as a percentage?
Hint: In Part b, you calculated the number of intervals containing the proportion 0.40. Divide this value by 10 to calculate the proportion.
Question 5
Now suppose we took 200 random samples of 100 college students and constructed a 95% confidence interval for each one. The picture below illustrates a simulated result of this situation (i.e., 200 confidence intervals constructed from our 200 random samples).
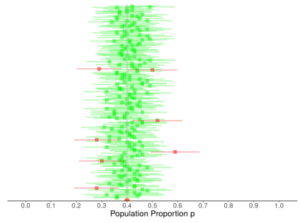
- The red lines in the previous picture represent the confidence intervals that did not contain the population proportion 0.40. Out of the 200 confidence intervals, how many of them did not contain the population proportion 0.40?
Hint: The red lines are those that did not contain the population proportion—how many red lines are in the previous picture? It might be easier to count the red squares to identify the number of confidence intervals that did not contain the population proportion. - Given your answer to the previous question and knowing there are 200 total confidence intervals, how many confidence intervals from this simulated result did contain the population proportion?
Hint: Subtract the value you calculated in Part a from 200 to identify the remaining number of intervals that did contain the population proportion. - Given your previous answers, what proportion of the 200 confidence intervals did contain the population proportion 0.40? What is this value as a percentage?
Hint: In Part b, you calculated the number of intervals containing the proportion 0.40. Divide this value by 200 to calculate the proportion.
If we wanted to, we could simulate taking an even larger number of samples from this population and constructing a confidence interval for each one.
(If you’d like, feel free to explore this further using the tool at https://dcmathpathways.shinyapps.io/ExploreCoverage. Be sure to set the population proportion to 0.40 and the sample size to 200.)
In the long run (i.e., if we were to repeatedly take more and more samples from the population and construct a confidence interval for each one), we would expect the proportion of confidence intervals containing the population proportion to be equal to the chosen confidence level.
Put another way, if we were constructing 95% confidence intervals, then in the long run, we would expect 95% of the intervals to contain the population proportion.
An important take-away is that the 95% (or some other chosen level of confidence) is associated with the method used to create the interval and not the likelihood that an individual interval contains the population proportion.
This means that anytime we provide a statement to interpret the meaning of a confidence interval, we should be sure to state that the confidence level is a measure of our confidence in the method.
Question 6
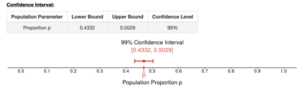
In 2010, researchers asked subjects whether they would be willing to pay much higher gas prices to protect the environment. The image below includes a 99% confidence interval, estimating the population proportion of individuals who would be willing to pay higher gas prices to protect the environment.
Which of the following is the correct interpretation of the interval calculated above?
- There is a 99% chance that the population proportion of individuals willing to pay higher gas prices is between 0.4332 and 0.5029, or 43.32% and 50.29%.
- We can be 99% confident that the population proportion of individuals willing to pay higher gas prices is between 0.4332 and 0.5029, or 43.32% and 50.29%.
Hint: Remember that the confidence level is not measuring the likelihood that an individual interval contains the population proportion.
Question 7
In the 2019 National College Health Assessment, 12,499 college students out of a total of 38,337 reported that they feel “very safe” on their campuses at night.[1]
- American College Health Association-National College Health Assessment. (2020). Undergraduate student reference group data report, Fall 2019. https://www.acha.org/NCHA/ACHA NCHA_Data/Publications_and_Reports/NCHA/Data/Reports_ACHA-NCHAIII.aspx ↵
