Preparing for the next class
In the next in-class activity, you will need to be able to identify the sample and population, calculate sample proportions and their differences, and identify independent vs. dependent samples. You will also need to know how to use technology to calculate the confidence interval for the difference in two proportions from independent samples and understand how to interpret the confidence interval in the context of the data.
Do job callbacks differ based on the perceived gender of the applicant? To examine this question, we will analyze data from an experiment[1] to assess the impact of gender and race on a job applicant receiving a callback, the opportunity to progress to the next part of the applicant process based on their application. The researchers submitted applications to job openings posted in Boston and Chicago in 2001 and 2002. The researchers randomly assigned names that are commonly associated with particular races and genders. The data are from the resume[2] dataset in the OpenIntro R package.
Question 1
In this preview assignment, we will focus on whether there was a difference between the proportion of callbacks for applications the researchers identified as being perceived as female and the proportion of callbacks for applications the researchers identified as being perceived as male.
Of the 3,746 applications with names perceived as female, 309 received callbacks. Of the 1,124 applications with names perceived as male, 83 received callbacks.
- What is the population of interest?
- Adults who submit job applications
- Female adults who submit job applications
- 3,746 applicants in the data who were perceived to be female
- 4,870 applicants in the data
- What is the sample?
- Adults who submit job applications
- Female adults who submit job applications
- 3,746 applicants in the data who were perceived to be female
- 4,870 applicants in the data
- Calculate [latex]\hat{p}[/latex], the proportion of applicants in the data who received callbacks.
- Calculate [latex]\hat{p_{F}}[/latex], the proportion of applicants perceived as female who received callbacks.
- Calculate [latex]\hat{p_{M}}[/latex], the proportion of applicants perceived as male who received callbacks.
Question 2
We are interested in understanding [latex]p_{F} - p_{M}[/latex], the true difference between the proportion of applicants perceived as female who received callbacks and the proportion of applicants perceived as male who received callbacks.
- Calculate the associated sample statistic [latex]\hat{p_{F}} - \hat{p_{M}}[/latex], the best guess for the difference in proportions given our data.
- Based on your answer to Part a, do you think the proportions of callbacks differ based on perceived gender? Explain.
Though we have an estimate, or a “best guess,” for the difference in proportions of applicants who received callbacks between the two groups, we expect there is some variability associated with that estimate. In other words, if we calculated the difference in the proportions of applicants who received callbacks from two other random samples of 3,746 applicants who were perceived as female and 1,124 applicants who were perceived as male, we would expect to get a different (yet probably close) value of [latex]\hat{p_{F}} - \hat{p_{M}}[/latex] compared to what we did in the previous exercise.
Similar to a single proportion, we can calculate a confidence interval to obtain a plausible range of values the true difference in proportions takes, assuming certain conditions hold. For the remainder of this assignment, you will focus on the independence condition and on using technology to calculate the confidence interval. In the in-class activity, you will learn more about the underlying mathematics and other conditions.
Question 3
There are two different methods for calculating confidence intervals for the difference in proportions. The method you use depends on whether the two groups are independent or dependent (paired). If the two groups are independent, the sample for one group is drawn independently of the other group. Knowing the observations of one group does not provide useful information about the other sample. Additionally, the groups can be different sizes.
If the two groups are dependent (also known as paired), the samples for the two groups are not drawn independently of one another. Knowing the observations of one group does provide useful information about the other sample. Additionally, both groups must be the same size.
Below are a few analysis objectives. Identify which of the following involves samples from independent groups. Select all that apply.
- Assess student learning by looking at the difference in the mean score of a statistics test taken at the beginning and end of the semester
- Assess the difference in proportions of students who major in statistics between public and private colleges
- Assess the difference in mean daily hours users spend on their phones between iPhone and Samsung users
- Assess the difference in participants’ fitness levels before and after a six-week training program
- Assess the difference in proportions of participants who pass a fitness test between those who do a six-week training program and those who don’t
Question 4
Let’s go back to the job applicants analysis. What are the two groups in this study? Are they independent or dependent? Select the best response.
- The two groups are those who received callbacks and those who didn’t. They are independent, since the sample for one group was drawn independently of the sample for the other group.
- The two groups are those who received callbacks and those who didn’t. They are not independent, since the sample for one group gives useful information about the sample for the other group.
- The two groups are those who were perceived as female and those who were perceived as male. They are independent, since the sample for one group was drawn independently of the sample for the other group.
- The two groups are those who were perceived as female and those who were perceived as male. They are not independent, since the sample for one group gives useful information about the sample for the other group.
Question 5
We will focus on calculating the confidence interval for the difference between two population proportions for independent groups. To calculate the confidence interval, use the Confidence Interval & Significance Test tab on the DCMP Compare Two Population Proportions tool: https://dcmathpathways.shinyapps.io/2sample_prop/.
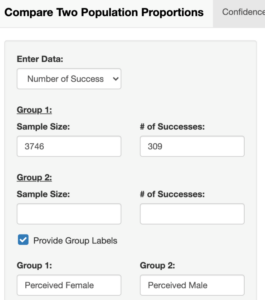
To enter the summary data at the beginning of this preview assignment, select “Number of Successes” under “Enter Data” on the left-hand side. Since we are interested in calculating the confidence interval for [latex]\hat{p_{F}} - \hat{p_{M}}[/latex], Group 1 is the group perceived as female and Group 2 is the group perceived as male.
Enter the number of successes and sample sizes for each group in the tool. You can also add informative group labels. The following is a screenshot to help you get started.
Once you have entered the information for both groups, the confidence interval will be calculated in the tool. You can change the confidence interval using the slider on the left-hand side.
What is the 95% confidence interval for the difference in proportions of applicants who received callbacks between those perceived as female and those perceived as male?
Question 6
What does the 95% confidence interval mean? Select all that apply.
- We are 95% confident that the true difference in proportions of applicants who received callbacks between those perceived as female and those perceived as male is between −0.009 and 0.0263.
- We are 95% confident that the difference in proportions of applicants who received callbacks between those perceived as female and those perceived as male in the sample is between −0.009 and 0.0263.
- The confidence interval does not provide sufficient evidence of a difference in the proportions of callbacks between the two groups since 0 is in the interval.
- The confidence interval does provide sufficient evidence of a difference in the proportions of callbacks between the two groups since 0 is in the interval.
e) There is a 95% probability that the true difference in proportions of applicants who received callbacks between those perceived as female and those perceived as male is between −0.009 and 0.0263.
- Bertrand, M. & Mullainathan, S. (2004). Are Emily and Greg more employable than Lakisha and Jamal? A field experiment on labor market discrimination. American Economic Review 94(4), 991–1013. DOI: 10.1257/0002828042002561. http://www.nber.org/papers/w9873 ↵
- Which resume attributes drive job callbacks? (Race and gender under study.) (n.d.). OpenIntro. Retrieved from https://www.openintro.org/data/index.php?data=resume ↵
