In the next preview assignment, you will need to calculate and interpret standardized scores, use a normal distribution to describe the sampling variability of a sample proportion, and use the Empirical Rule to identify unusual values in a normal distribution.
Standardized Scores
In In-Class Activity 4.E, you learned to compute and interpret standardized scores by subtracting the mean and dividing by the standard deviation.
[latex]standardized~error = \frac{data~value - mean}{standard~deviation}[/latex]
A standardized score describes how far a data value is from the mean in terms of the standard deviation. For example, a standardized score of -2 means that the data value is 2 standard deviations below the mean.
Standardized scores are useful for deciding whether a value is unusual relative to its distribution. They are also useful for comparing values that are on different scales.
Question 1
Suppose Brett took a test where the class average was a 75 with a standard deviation of 10. He made a 93 on the test. Calculate and interpret his standardized score.
Question 2
Suppose Isabel took a test where the class average was a 70 with a standard deviation of 6. She made a 90 on the test. Calculate and interpret her standardized score. Round to two decimal places.
Question 3
Which of the previous test scores is more unusual, relative to its own distribution?
Sampling Distribution of a Sample Proportion
In In-Class Activity 9.C, you learned that a normal distribution can be used to describe the sampling distribution of a sample proportion as long as the sample size is large enough:
[latex]np \geq 10[/latex] and [latex]n(1-p) \geq 10[/latex]
Further, the center of the sampling distribution will be equal to the value of the population proportion, [latex]p[/latex], and the standard error formula can be used to describe the spread of the sampling distribution. (When the population proportion is known, the standard error calculated using this formula is the standard deviation of the sampling distribution.)
[latex]SE = \sqrt{\frac{p(1-p)}{n}}[/latex]
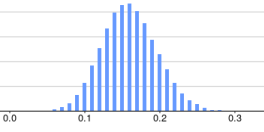
Example: Out of over 5,000 students admitted to the University of Georgia in a recent year, 16% came from outside the state of Georgia. How many out-of-state students would we expect to see in a random sample of 100 freshmen the following year?
Question 4
Would you expect the proportion of out-of-state students to be exactly 0.16 in every random sample of size 100? Explain.
Question 5
What would be more common: a sample proportion close to 0.16 or a sample proportion far from 0.16?
The following graph shows the sampling distribution for this scenario.
Question 6
Add a label to the x-axis of the sampling distribution.
Question 7
Is it reasonable to describe the sampling distribution using a normal distribution? Justify your answer by checking the sample size condition.
Question 8
What is the mean of this sampling distribution? In other words, where is the distribution centered?
Question 9
Calculate the standard error. In other words, calculate the standard deviation of the sampling distribution of the sample proportion. Round to three decimal places.
Question 10
By the Empirical Rule, about 95% of sample proportions fall between ___ and ___.
Practice
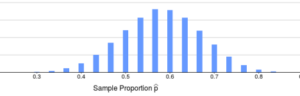
In a recent year, 58% of male students at Millsaps College were members of a fraternity. How many fraternity members would we expect to see in a random sample of 30 male students from Millsaps College? The following graph shows the sampling distribution for this scenario.
Question 11
Is it reasonable to describe the sampling distribution using a normal distribution? Justify your answer by checking the sample size condition.
Question 12
What is the mean of this sampling distribution? In other words, where is the distribution centered?
Question 13
Calculate the standard error. In other words, calculate the standard deviation of the sampling distribution of the sample proportion. Round to three decimal places.
Question 14
About 99.7% of sample proportions would fall between ___ and ___. Use the Empirical Rule.
