Bottled water companies spend huge sums of money to market their products, touting their purity, rejuvenating minerals, and superior taste.
At the same time, environmentalists are concerned about the impact of all those plastic bottles, many of which are not recycled. Why does bottled water remain so popular? Do consumers actually prefer the taste of bottled water or are there other factors at play?
Question 1
How would you design a study to test whether consumers prefer the taste of bottled water or tap water?
Question 2
You conduct a taste test to investigate whether consumers prefer the taste of bottled water or tap water.
- State the null and alternative hypotheses in words.
- State the null and alternative hypotheses in terms of the proportion of consumers who prefer bottled water.
Question 3
Consider the following four datasets that might have resulted from this taste test.
- Which of the two taste tests that follow provides more evidence of a preference for bottled water or tap water?
Results Taste Test A 30 people participate. 17 prefer bottled water.
Taste Test B 30 people participate. 21 prefer bottled water.
- Which of the two taste tests that follow provides more evidence of a preference for bottled water or tap water?
Results Taste Test C 50 people participate. 22 prefer bottled water.
Taste Test D 100 people participate, 44 prefer bottled water.
- Which of the two taste tests that follow provides more evidence of a preference for bottled water or tap water?
Hint: It may help to calculate the sample proportions and then locate those values on the appropriate sampling distributions given on the next page.Results Taste Test B 30 people participate. 21 prefer bottled water.
Taste Test D 100 people participate. 44 prefer bottled water.
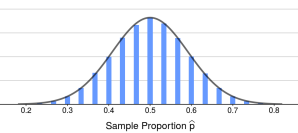
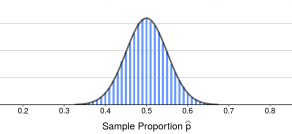
The following graphs are sampling distributions that show the proportion we would expect to choose bottled water in the sample if there was no preference in the population.
| Sample size = 30
Standard error of [latex]\hat{p}[/latex]= 0.091 |
 |
| Sample size = 100
Standard error of [latex]\hat{p}[/latex]= 0.050 |
 |
Question 4
A test statistic measures the distance between the sample statistic and the null hypothesis value in terms of the standard error of the statistic.
[latex]test~statistic = \frac{sample~statistic - null~hypothesis~value}{standard~error~of~the~statistic}[/latex]
When the sample statistic is a proportion like it is in this example (bottled/tap), the test statistic is also called a z-statistic.
- Calculate the test statistic for each taste test.
Study Results [latex]\hat{p}[/latex] Test Statistic Taste Test B 30 people participate. 21 prefer bottled water.
[latex]\frac{21}{30}=0.7[/latex] Taste Test D 100 people participate. 44 prefer bottled water. - Write a sentence to interpret the test statistic for Taste Test B and Taste Test D.
- Write a sentence to describe how the test statistic and the evidence against the null hypothesis are related to each other.
Assuming the sample size is large enough, we can use the normal distribution to model the values of the sample proportion that would occur if the null hypothesis is true. In In-Class Activity 9.C, you learned that the sample size is considered “large enough” when the following condition is met:
[latex]np \geq 10, n(1-p) \geq 10[/latex]
Since the normal distribution is being used to model the values of the sample proportion that would occur if the null hypothesis is true, we can check the condition by replacing [latex]p[/latex] with the value from the null hypothesis ([latex]p = 0.5[/latex] in the bottled water taste test example).
The following graph shows the null distribution for a sample size of 100 (standard error = 0.05). Note that the mean of the null distribution is 0.5—the value from the null hypothesis in the bottled water taste test.
Question 5
Let’s think about the values of the test statistic that would occur if the null hypothesis is true.
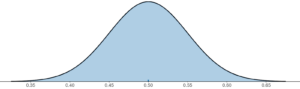
- Identify the value of the test statistic for each numerical value marked on the x-axis of the normal distribution above. Write the values below the x-axis.
- If the sample proportion was equal to the null hypothesis value (0.5), the test statistic would take a value of ____.
- If the sample proportion had a value that was one standard error above the null hypothesis value (0.55), the test statistic would take a value of ____.
Question 6
A taste test was conducted with a group of statistics students in Florida. Out of the 22 students who participated, 20 preferred the taste of bottled water.
- Before you calculate anything, make predictions about the z-statistic. Do you think the value will be positive or negative? Do you think the value will be far from 0 or close to 0?
- When the sample size is 22, the standard error is 0.107. Why is this standard error larger than the standard error for Taste Tests B and D?
- Calculate the test statistic for this sample.
- Is it reasonable to use a normal distribution with a mean of 0 and a standard deviation of 1 to model the distribution of the test statistic that would occur if the null hypothesis is true?
Hint: Check the sample size condition. - Is the null hypothesis (no preference for bottled water or tap water) a plausible explanation for these data? Explain.
- Do you think it is safe to generalize these results to other parts of the country? Explain.
