Preparing for the next class
In the next in-class activity, you will need to be able to calculate and interpret standardized scores and use a normal distribution to describe the sampling variability of a sample proportion. You will also need to be able to identify sample size as a factor that affects precision in sampling and use the Empirical Rule to identify unusual values in a normal distribution.
Questions 1–3: A real estate agent sells houses in two different neighborhoods. In Neighborhood A, the distribution of house prices has a mean of $300,000 with a standard deviation of $35,000. In Neighborhood B, the distribution of house prices has a mean of $500,000 with a standard deviation of $120,000.
Question 1
Calculate and interpret the standardized score (z-score) for a house that costs $180,000 in Neighborhood A.
Hint: You learned about standardized scores in In-Class Activity 4.E.
Question 2
Calculate the standardized score (z-score) for a house that costs $250,000 in Neighborhood B.
Question 3
Which of the following houses is more unusual, relative to the distribution of prices in its own neighborhood?
- a) A house that costs $180,000 in Neighborhood A
- b) A house that costs $250,000 in Neighborhood B
Hint: Compare by using the standardized scores calculated previously.
Questions 4–7: A statistics teacher gave each of her students a spinner with four equal sized sections: one red, one blue, one yellow, and one green. She asked each of them to spin their spinner 50 times, record the proportion of times their spinner landed on red, and add the value to a class dotplot. They repeated this process until they had a plot with many dots, with each dot representing a sample proportion ([latex]\hat{p_{Red}}[/latex]) from a spinner that is 25% red.
Question 4
Where would you expect the class dotplot to be centered?
Hint: In other words, what would the mean of the sampling distribution be? You learned how to describe the sampling distribution of a sample proportion in In-Class Activity 9.C.
Question 5
Calculate the standard error of the sample proportion, which estimates the spread of the class dotplot.
Question 6
What would you expect the shape of the class dotplot to be?
- a) Skewed left
- b) Skewed right
- c) Approximately normal
Hint: The sampling distribution becomes more normal as the sample size increases. Is this sample size large enough? You learned how to describe the sampling distribution of a sample proportion in In-Class Activity 9.C.
Question 7
Suppose the teacher had asked each student to spin the spinner 100 times per set instead of 50 times per set. How would the larger sample size affect the standard error calculated in Question 5?
- a) A larger sample size would cause the standard error to be larger.
- b) A larger sample size would cause the standard error to be smaller.
- c) A larger sample size would not affect the standard error.
Hint: In In-Class Activity 9.B, you discussed the factors that affect precision in sampling.
Questions 8 and 9: The following graph shows a normal distribution with a mean of 0 and a standard deviation of 1.
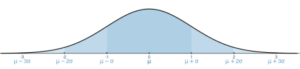
Question 8
Approximately what percentage of values would fall more than 2 standard deviations away from the mean (below –2 or above 2)?
Hint: Use the Empirical Rule that you learned in In-Class Activity 4.E.
Question 9
Approximately what percentage of values would fall more than 3 standard deviations away from the mean (below −3 or above 3)?
Hint: Use the Empirical Rule that you learned in In-Class Activity 4.E.
