| Reject the null hypothesis | Do not reject the null hypothesis | |
| Null hypothesis is correct | Type I error | No error |
| Null hypothesis is incorrect | No error | Type II error |
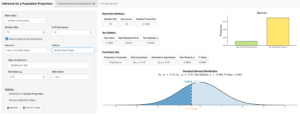
| Sample Size | Sample Proportion | P-value | |
| Question 1 | |||
| Question 4 |
| Skill or Concept: I can . . . | Questions to check your understanding | Rating from 1 to 5 |
| Identify statistical significance. | 2 | |
| Identify practical significance. | 3 | |
| Describe the factors that affect the size of the P-value. | 4–6 |

| Commonly-White Names | Commonly-Black Names | Total | |
| Called back | 246 | 164 | 410 |
| Not called back | 2,199 | 2,281 | 4,480 |
| Total | 2,445 | 2,445 | 4,890 |
| Group | Sample Size | Successes | Sample Proportion |
| Female | 1,233 | 1,026 | 0.8321 |
| Male | 1,009 | 757 | 0.7502 |
| Skill or Concept: I can . . . | Questions to check your understanding | Rating from 1 to 5 |
| Distinguish between situations that require a one-sample test of proportions or a two-sample test of proportions. | 1–4 | |
| Set up the hypotheses for a two-sample test of proportions. | 5 |


Glossary 11E
- type I error
- rejection of a correct null hypothesis.
- type II error
- not rejecting a null hypothesis that is actually incorrect.
- statistical significance
- having enough evidence against the null hypothesis to convince us to reject the null hypothesis.
- practical significance
- having results that are meaningful
Glossary 11F
- two-sample test of proportions
- a test that tests a claim about two population proportions.
