In the next preview assignment and in the next class, you will need to be able to perform computations using proportions, interpret proportions, and work with inequalities.
To practice these skills, you’ll be working with some of the findings from a Pew Research Center survey conducted in January 2021 about American adults’ perceptions of the financial impact of the COVID-19 pandemic.[1] The survey randomly selected 10,334 U.S. adult respondents.
Proportions
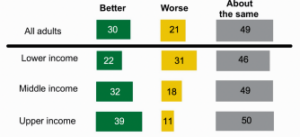
A graphic similar to the one found in the article is shown below. The survey was conducted in January 2021; the COVID-19 pandemic began in March 2020.
Note: Some rows do not add to 100% because the shares of respondents who didn’t offer answers are not shown.
The graphic shows the percentages of respondents saying that, compared with one year earlier, their financial situations (and that of their families) were better, worse, or about the same.
Question 1
Use the graphic to answer the following questions.
- Part A: What percentage of all adults surveyed said that their financial situations were about the same as one year earlier?
- Part B: How would you write this proportion as a decimal?
- Part C: How many adults surveyed said their financial situations were about the same as one year earlier?
- Part D: Is your answer to Part C a reasonable answer? If not, describe how you would adjust your response to Part C in order to find the number of adults surveyed who said that their financial situations were about the same as one year earlier.
- Part E: Use a fraction to express the proportion of adults surveyed who said that their financial situations were about the same as one year earlier.
Question 2
Using information from the methodology of the survey,[2] we find that about 2,279 middle-income respondents said that their financial situations were about the same as one year earlier and about 982 upper-income respondents said the same.
- Part A: Does this mean that people in the middle-income category are more likely to have a financial situation that didn’t changed much in the last year?
- Part B: It turns out that there were about 4,650 middle-income respondents and 1,963 upper-income respondents. What proportion of each group reported financial situations that were about the same as a year earlier?
Question 3
What percentage of adults surveyed reported financial situations that were not about the same as one year earlier? Describe at least two ways to find this.
Inequalities
In Questions 4–8, we will continue using the same graphic but will focus on the respondents who said that their financial situations were better than they were one year earlier.
Question 4
Would you expect the proportion of U.S. adults who said their financial situations were better than they were one year earlier to be higher among lower-income adults or upper-income adults? Explain.
Question 5
How does the data compare with your answer to Question 4?
Question 6
Let [latex]p_{L}[/latex] represent the true proportion of all U.S. lower-income adults who said their financial situations were better than they were one year earlier, and let [latex]P_{U}[/latex] represent the true proportion of all U.S. upper-income adults who said their financial situations were better than they were one year earlier.
- Part A: Write an inequality that relates these two quantities.
- Part B: Do you expect the quantity [latex]p_{L} - P_{U}[/latex] to be positive or negative? Explain.
- Part C: Express your answer to Part B using an inequality.
- Part D: Do you expect the quantity [latex]p_{L} - P_{U}[/latex] to be positive or negative? Explain.
- Part E: Express your answer to Part D using an inequality.
Question 7
Let [latex]\hat{p_{L}}[/latex] represent the sample proportion (written as a decimal) of lower-income respondents who said their financial situations were better than they were one year earlier, and let [latex]\hat{p_{U}}[/latex] represent the sample proportion (written as a decimal) of upper-income respondents who said their financial situations were better than they were one year earlier.
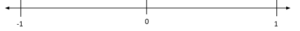
Label [latex]\hat{p_{L}}[/latex] and [latex]\hat{p_{U}}[/latex] on the following number line. Use the number line to explain whether [latex]\hat{p_{U}} - \hat{p_{L}}[/latex] is positive or negative.
Hint: You can find the values of [latex]\hat{p_{L}}[/latex] and [latex]\hat{p_{U}}[/latex] in the graphic containing information from the article.
Question 8
On its own, does your answer to Question 5 provide enough evidence to support your answer to Question 4?
- Horowitz, J. M., Brown, A., & Minkin, R. (2021, March 5). A year into the pandemic, long-term financial impact weighs heavily on many Americans. Pew Research Center. https://www.pewresearch.org/social trends/2021/03/05/a-year-into-the-pandemic-long-term-financial-impact-weighs-heavily-on-many americans/ ↵
- Horowitz, J. M., Brown, A., & Minkin, R. (2021, March 5). Methodology. Pew Research Center. https://www.pewresearch.org/social-trends/2021/03/05/methodology-42/ ↵
