In 2004, two University of Chicago economists (Marianne Bertrand and Sendhil Mullainathan) decided to conduct an experiment[1] to test for labor market discrimination.
The investigators created 4,890 mock identical resumés, which were sent to job placement ads in Chicago and Boston. To gauge market racial discrimination, each resumé was randomly assigned either a commonly-white or commonly-black name. The experimenters then measured the proportion of resumés from each group (white and black) that received callbacks.[2]

Credit: iStock/Mitoria
Question 1
Conducting this experiment took a lot of work and resources. Why didn’t the investigators just compare observed black and white wages in current data? Why do you believe they went through all the trouble of conducting this experiment?
Questions 2–6: These questions reference the study results, which are summarized in the following table:
| Commonly-White Names | Commonly-Black Names | Total | |
| Called back | 246 | 164 | 410 |
| Not called back | 2,199 | 2,281 | 4,480 |
| Total | 2,445 | 2,445 | 4,890 |
[latex]p_{1}[/latex] = true proportion of commonly-white-named resumés that received callbacks
[latex]p_{2}[/latex] = true proportion of commonly-black-named resumés that received callbacks
Question 2
Before conducting a test, let’s explore the results.
- Part A: Calculate and (the sample proportions of white/black-named resumés that received callbacks, respectively).
- Part B: Are these two sample proportions different enough to show that the difference didn’t occur by chance alone? Justify using basic reasoning (without conducting a hypothesis test).
- Part C: If the sample sizes were only 20 resumés per group, would you be more likely to believe the difference in proportions could have occurred by chance alone? Explain.
Question 3
If we wanted to test if the difference in callback rates is statistically significant, should we use a one-sample or two-sample inference procedure? Explain.
Question 4
We will now conduct a two-sample z-test of proportions. Here are the hypotheses for this test:
*MISSING LaTeX*
- Part A: In which hypothesis are the callback rates between the groups equal? In which hypothesis could the commonly-white names get higher callback rates?
- Part B: What is the null hypothesis value of the difference in proportions?
Question 5
To ensure our inferences are accurate, we must check certain conditions for conducting a two-sample z-test of proportions:
- Part A: Confirm that the data were collected via a random sample or an experiment with random assignment to treatment. This would allow us to propose that we have comparable experimental groups.
- Part B: Confirm that we have a large enough sample size to meet the “sample size” condition. This will help ensure that the underlying sampling distribution we use to calculate the P-value can be modeled with a normal curve. The conditions are:
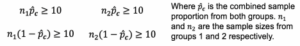
To calculate the combined (“pooled”) sample proportion, add the total number of candidates that received callbacks in both groups and divide this sum by the total number of people in the study:
[latex]\hat{p_{c}} \frac{x_{1}+x_{2}}{n_{1}+n_{2}}, where [latex] x_{1}[/latex] and [latex]x_{2}[/latex] are the number of “successes” from Groups 1 and 2, respectively.
Note: The final condition is that the sample sizes are each less than a tenth of the size of the populations from which they’re drawn [[latex]n_{1} < 0.10(N_{1})[/latex] and [latex]n_{2} < 0.10(N_{2})[/latex]]. This helps ensure our estimates for the standard errors are accurate. However, this condition does not need to be checked in the case of a randomized experiment.
Conditions for Two-Sample Z-Test of Proportions
- Large Counts: Check that *MISSING LATEX*
- Random Samples/Assignment: Check that the two samples are independent and random samples or that they come from randomly assigned groups in an experiment.
- 10%: Check that *MISSING LATEX*.
Question 6
Go to the DCMP Compare Two Population Proportions tool at
https://dcmathpathways.shinyapps.io/2sample_prop/. Select the “Number of successes” option and input the relevant data from the study. Under the type of inference section, select “Significance Test” and the appropriate alternative hypothesis.
- Part A: Interpret the “observed difference” value. How was this calculated and what does it mean?
- Part B: State and interpret the z-test statistic value.
- Part C: State and interpret the P-value.
- Part D: Using the previous information, draw a conclusion for this test. State what your conclusion means in the context of the study. Use significance level [latex]\alpha =0.05[/latex].
Question 7
We found that the difference between callback rates was statistically significant, but is it practically significant? Justify your answer using the observed difference in sample proportions.
