| Group | Group 1 (Wikipedia) | Group 2 (WebMD) |
| Sample size | ||
| Sample mean reading ease score | ||
| Sample standard deviation |
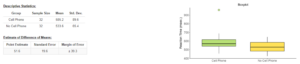
| Group | Self-Monitor Group | Fitness Tracker Group |
| Sample size | 170 | 181 |
| Sample mean weight loss | 5.9 kg | 3.5 kg |
| Sample standard deviation | 3.5 kg | 6.3 kg |
| Skill or Concept: I can . . . | Questions to check your understanding | Rating from 1 to 5 |
| Determine whether samples are independent or paired. | 1, 2 | |
| Use information from independent samples to assess whether the assumptions/conditions for the two-sample t confidence interval are reasonably met. | 3 |

| Variable | Description |
| country | Country of cleanup |
| year | Year (2019 or 2020) |
| parent_company | Source of plastic |
| empty | Category left empty count |
| hdpe | High-density polyethylene count (plastic milk containers, plastic bags, bottle caps, trash cans, oil cans, plastic lumber, toolboxes, supplement containers) |
| Idpe | Low-density polyethylene count (plastic bags, Ziploc bags, buckets, squeeze bottles, plastic tubes, chopping boards) |
| other_count | Category marked other count |
| pet | Polyester plastic count (polyester fibers, soft drink bottles, food containers [also see plastic bottles]) |
| pp | Polypropylene count (flower pots, bumpers, car interior trim, industrial fibers, carry-out beverage cups, microwavable food containers, DVD cases) |
| ps | Polystyrene count (toys, video cassettes, ashtrays, trunks, beverage/food coolers, beer cups, wine and champagne cups, carry-out food containers, styrofoam) |
| pvc | PVC plastic count (window frames, bottles for chemicals, flooring, plumbing pipes) |
| grand_total | Grand total count (all types of plastic) |
| num_events | Number of counting events |
| volunteers | Number of volunteers |
| Skill or Concept: I can . . . | Questions to check your understanding | Rating from 1 to 5 |
| Calculate the mean and standard deviation of a variable. | 1, 2 | |
| Create a histogram. | 3 | |
| Describe the shape and spread of a histogram. | 4 | |
| Describe null and alternative hypotheses. | 5–8 | |
| Identify the difference between a one-tailed and two-tailed hypothesis test. | 6, 7 |
NO ALT TEXT

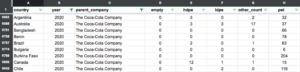
| A | B | C | D | E | F | G | H | |
| 1 | country | year | parent_company | empty | hdpe | ldpe | other_count | pet |
| 9502 | Argentina | 2020 | The Coca-Cola Company | 0 | 3 | 0 | 2 | 32 |
| 9588 | Australia | 2020 | The Coca-Cola Company | 0 | 3 | 3 | 17 | 37 |
| 9731 | Bangladesh | 2020 | The Coca-Cola Company | 0 | 0 | 0 | 0 | 66 |
| 9738 | Benin | 2020 | The Coca-Cola Company | 0 | 0 | 0 | 0 | 78 |
| 9757 | Brazil | 2020 | The Coca-Cola Company | 0 | 2 | 0 | 1 | 63 |
| 9774 | Bulgaria | 2020 | The Coca-Cola Company | 0 | 0 | 0 | 0 | 6 |
| 9788 | Burkina Faso | 2020 | The Coca-Cola Company | 0 | 0 | 0 | 0 | 204 |
| 9830 | Canada | 2020 | The Coca-Cola Company | 0 | 12 | 1 | 1 | 15 |
| 9943 | Chile | 2020 | The Coca-Cola Company | 0 | 0 | 2 | 0 | 119 |
| 2019 | 2020 |
| Nestle | Nestle |
| PepsiCo | PepsiCo |
| Unilever | |
| Mondelez International | |
| Mars, Incorporated |
| Size | Mean | Standard Deviation | |
| Sample | 125 | 183.4 mg/dl | 15 |
| Skill or Concept: I can . . . | Questions to check your understanding | Rating from 1 to 5 |
| Identify the null and alternative hypotheses for a one-sample test for means. | 1, 2 | |
| Identify that you collect sample data after stating the null and alternative hypotheses. | 3, 4 | |
| Identify that you check test assumptions after collecting sample data. | 5 | |
| Identify that you summarize the data using a test statistic after checking test assumptions. | 6 | |
| Identify that you calculate a P-value after calculating the test statistic. | 7 | |
| Identify that you interpret the test results in context after calculating the P-value. | 8 |
- independent samples
- samples where one is selected from one population and another is independently selected from the second population.
- paired samples
- samples chosen in a way that results in the observations in one sample being paired with the observations in the other sample; also called dependent samples.
