|
Participant |
Number of Colony-forming Units (CFU) before Sanitizer | Number of Colony-forming Units (CFU) after Sanitizer |
| 1 | 11.8 | 12.1 |
| 2 | 10.8 | 12.0 |
| 3 | 9.1 | 3.8 |
| 4 | 14.6 | 10.1 |
| 5 | 8.2 | 6.3 |
| 6 | 14.1 | 11.1 |
| 7 | 13.0 | 7.2 |
| 8 | 14.0 | 13.7 |
|
Participant |
Number of Colony-forming Units (CFU) before Sanitizer | Number of Colony-forming Units (CFU) after Sanitizer |
Difference
|
| 1 | 11.8 | 12.1 | 0.3 |
| 2 | 10.8 | 12.0 | 1.2 |
| 3 | 9.1 | 3.8 | |
| 4 | 14.6 | 10.1 | |
| 5 | 8.2 | 6.3 | |
| 6 | 14.1 | 11.1 | |
| 7 | 13.0 | 7.2 | |
| 8 | 14.0 | 13.7 |
| Participant | Reaction Time (in milliseconds) | |
| Cell Phone Use = Yes | Cell Phone Use = No | |
| 1 | 636 | 604 |
| 2 | 623 | 556 |
| 3 | 615 | 540 |
| 4 | 672 | 522 |
| 5 | 601 | 459 |
| 6 | 600 | 544 |
| 7 | 542 | 513 |
| 8 | 554 | 470 |
| 9 | 543 | 556 |
| 10 | 520 | 531 |
| Participant | Reaction Time (in Milliseconds) | Difference | |
| Cell Phone Use = Yes | Cell Phone Use = No | ||
| 1 | 636 | 604 | |
| 2 | 623 | 556 | 67 |
| 3 | 615 | 540 | 75 |
| 4 | 672 | 522 | 150 |
| 5 | 601 | 459 | 142 |
| 6 | 600 | 544 | 56 |
| 7 | 542 | 513 | 29 |
| 8 | 554 | 470 | 84 |
| 9 | 543 | 556 | -13 |
| 10 | 520 | 531 | 11 |
| 11 | 609 | 599 | 10 |
| 12 | 559 | 537 | 22 |
| 13 | 595 | 619 | 24 |
| 14 | 565 | 536 | 29 |
| 15 | 573 | 554 | 19 |
| 16 | 554 | 467 | 87 |
| 17 | 626 | 525 | 101 |
| 18 | 501 | 508 | 7 |
| 19 | 574 | 529 | 45 |
| 20 | 468 | 470 | 2 |
| 21 | 578 | 512 | 66 |
| 22 | 560 | 487 | 73 |
| 23 | 525 | 515 | 10 |
| 24 | 647 | 499 | 148 |
| 25 | 456 | 448 | 8 |
| 26 | 688 | 558 | 130 |
| 27 | 679 | 589 | 90 |
| 28 | 960 | 814 | 146 |
| 29 | 558 | 519 | 39 |
| 30 | 482 | 462 | 20 |
| 31 | 527 | 521 | 6 |
| 32 | 536 | 543 | 7 |
| Hypothesis | Notation | |
| Null | There is no difference between the mean reaction times while using a cell phone and while not using a cell phone. |
|
| Alternative |
|
| Station | Average Temp 1951–2000 | Average Temp
1901–1950 |
Difference |
| Sable Island | 7.420 | 6.803 | 0.617 |
| Manila Int Airport | 27.416 | 26.779 | 0.637 |
| Perm | 2.208 | 1.670 | 0.538 |
| Hobart Ellerslie | 13.062 | 12.549 | 0.513 |
| Bulawayo Goetz | 19.183 | 18.891 | 0.292 |
| Veraval | 26.779 | 26.404 | 0.375 |
| Yokohama | 15.428 | 14.534 | 0.894 |
| Punta Arenas | 6.752 | 6.828 | –0.077 |
| Aldergrove | 9.012 | 8.888 | 0.124 |
| Harare Kutsaga | 19.055 | 18.816 | 0.239 |
| Bahia Blanca Aero | 15.204 | 14.963 | 0.241 |
| Cape Leeuwin | 16.983 | 16.608 | 0.375 |
| Maliye Karmakuly | –5.044 | –5.036 | –0.008 |
| Hobarttasmanwas | 12.638 | 12.439 | 0.199 |
| Svyatoy Nos Cape | 0.263 | –0.263 | 0.527 |
| Apia | 26.479 | 26.380 | 0.099 |
| Aparri | 26.091 | 25.288 | 0.803 |
| Syktyvkar | 0.894 | 0.435 | 0.460 |
| Upernavik | –7.286 | –7.012 | –0.274 |
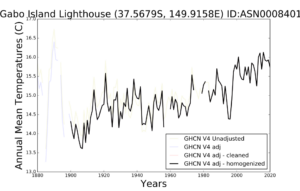
| Gabo Island | 14.924 | 14.925 | –0.001 |
| Antananarivoville | 17.741 | 17.387 | 0.354 |
| Kumasi | 25.854 | 25.652 | 0.202 |
| Khartoum | 28.874 | 28.535 | 0.339 |
| Mahe Seychellesbri | 26.872 | 26.414 | 0.459 |
| Onslow | 24.540 | 24.154 | 0.387 |
| Rarotonga Intl | 24.157 | 24.105 | 0.052 |
| Ponta Delgada | 15.676 | 14.942 | 0.734 |
| Viljujsk | –9.057 | –8.854 | –0.203 |
| Andenes | 3.160 | 2.600 | 0.560 |
| Kyzylorda | 10.411 | 9.631 | 0.780 |
| Port Blair | 26.778 | 26.506 | 0.271 |
| Chatham Islands | 11.132 | 10.392 | 0.739 |
| Patient | Before | After |
| 1 | 150 | 146 |
| 2 | 160 | 159 |
| 3 | 200 | 200 |
| 4 | 178 | 174 |
| 5 | 190 | 189 |
| 6 | 167 | 160 |
| 7 | 151 | 148 |
| 8 | 210 | 198 |
| Mean ( |
| Patient | Before | After | Difference |
| 1 | 150 | 146 | 146–150 4 |
| 2 | 160 | 159 | 159–160 1 |
| 3 | 200 | 200 | |
| 4 | 178 | 174 | |
| 5 | 190 | 189 | |
| 6 | 167 | 160 | |
| 7 | 151 | 148 | |
| 8 | 210 | 198 | |
| Mean ( |
| Null Hypothesis for
Independent Samples |
Null Hypothesis for
Dependent Samples |
| Alternative Hypothesis
for Independent Samples |
Alternative Hypothesis
for Dependent Samples |
| Summary Statistics | Notation |
| Population Mean of Difference | |
| Sample Mean of Difference | |
| Population Standard Deviation of Difference | |
| Sample Standard Deviation of Difference |
| Skill or Concept: I can . . . | Questions to check your understanding | Rating from 1 to 5 |
| Identify the differences between independent and dependent samples. | 1–7 | |
| Calculate the mean of a difference. | 8–9 |

Glossary
- dependent sample
- a sample where the same variable is recorded for each sample, and there is a logical way to pair the observations from one sample with the observations in the other sample.
- independent sample
- a sample where samples are independently selected, the same variable is measured for both samples, but there is no logical way to pair an observation from one sample with a particular observation from the other sample.
- paired t-test
- a test comparing the mean of the differences, 𝜇𝑑,to a hypothesized value, which is often 0, also called a dependent t-test.
