14C

City Mean High Temperature[1]
Miami 84 °F
Phoenix 87 °F
Honolulu 84 °F

[1] U.S. climate data. (2021). https://www.usclimatedata.com/climate/united-states/us
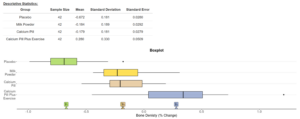
A dark blue circle with the number 1 in it A somewhat dark blue circle with the number 2 in it A light blue circle with the number 3 in it A dull blue circle with the number 4 in it  A bright blue circle with the number 5 in it
A dark blue circle with the number 1 in it A reddish purple circle with the number 2 in it A bright indigo circle with the number 3 in it A purple circle with the number 4 in it A dark indigo circle with the number 5 in it
A blue circle with the number 1 in it A blue circle with the number 2 in it A yellow circle with the number 3 in it A blue circle with the number 4 in it  A blue circle with the number 5 in it
Placebo Milk Calcium Pill Calcium Pill Plus Exercise
-0.46 -0.02 -0.2 0.53
-0.57 -0.43 -0.07 0.54
-0.7 -0.24 -0.3 0.11
-0.61 0.05 -0.26 0.42
-0.65 -0.44 -0.38 0.73
-0.62 -0.1 0.01 1.21
-0.93 -0.35 -0.23 0.67
-0.83 -0.02 0.11 0.63
-0.7 -0.21 0.1 0.25
-0.65 0.31 0.07 0.07
-0.62 -0.06 -0.28 0.34
-0.92 -0.4 -0.19 0.32
-0.33 -0.04 0.02 0.18
-0.7 -0.14 -0.14 -0.02
-0.47 -0.39 -0.25 0.53
-0.71 0.05 -0.21 0
-0.94 -0.05 0 0.34
-0.47 0.06 -0.54 0.04
-0.52 -0.35 -0.2 0.6
-0.85 -0.4 -0.06 0
-0.38 -0.34 -0.27 0.35
-0.76 -0.3 0.06 -0.45
-0.71 -0.35 -0.14 -0.26
-0.77 -0.2 -0.33 0.33
-0.73 -0.38 -0.4 -0.05
-0.67 -0.27 -0.21 -0.12
-0.68 0.3 -0.23 0.51
-0.67 -0.29 -0.38 0.29
-0.68 -0.25 -0.43 0.32
-0.52 -0.1 -0.27 0.39
-0.18 -0.34 0.1 0.38
-0.8 -0.36 -0.21 -0.32
-0.99 -0.22 -0.34 0.36
-0.49 -0.06 -0.13 0.39
-0.81 -0.26 -0.18 0.58
-0.8 -0.27 0 -0.07
-0.66 0.1 -0.37 0.37
-0.84 0.03 0.07 0.61
-0.83 -0.18 0.19 0.04
-0.86 -0.25 -0.42 0.5
-0.31 -0.2 -0.17 -0.34
-0.82 -0.37 -0.47 0.47
Study # Smallest SD Largest SD Similar variability?
1 3.06 3.79 Yes
2 0.22 2.54 No
3 1.57 3.32 No
4 2.39 4.16 Yes
Skill or Concept: I can . . . Questions to check your understanding Rating
from 1 to 5
Identify the right types of data for an ANOVA. 1–3
Determine if ANOVA groups are independent random samples. 4, 5
Determine if groups have similar levels of variability. 6, 7

A box plot labeled “Daily High Temperature” on the horizontal axis, with “Miami,” “Phoenix,” and “Honolulu” on the vertical axis. For Miami, the low point is at approximately 75 and the high point is at approximately 92. The low end of the box is at approximately 80, the high end is at approximately 88, and the middle line is at approximately 84. For Phoenix, the low point is at approximately 66 and the high point is at approximately 105. The low end of the box is at approximately 75, the high end is at approximately 101 and the middle line is at approximately 87. For Honolulu, the low point is at approximately 80 and the high point is at approximately 89. The low end of the box is at approximately 81, the high end of the box is at 87, and the middle line is at approximately 84. There are also point on the horizontal axis corresponding to each of the middle lines and labeled “y bar sub 1,” “y bar sub 2,” and “y bar sub 3,” respectively. A box plot with A, B, C, D on the vertical axis. For A, the low point is at approximately 0, the high point is at approximately 5, the low end of the box is at approximately 1, the high end is at approximately 3, and the middle line is at approximately 2. For B, the low point is at approximately 1, the high point is at approximately 5, the low end of the box is at approximately 2.25, the high end of the box is at approximately 3.5, and the middle line is at approximately 3. For C, the low point is at approximately 1, the high point is at approximately 7, the low end of the box is at approximately 2, the high end of the box is at approximately 4.25, and the middle line is at approximately 4. For D, the low point is at approximately 2.5, the high point is at approximately 8, the low end of the box is at approximately 4, the high end is at approximately 6, and the middle line is at approximately 5. There are points “y bar sub 1” at approximately 2, “y bar sub 2” at approximately 3, “y bar sub 3” at approximately 3.5, and “y bar sub 4” at approximately 5. A table and box plot. The table is labeled “Descriptive Statistics” and has columns “Group,” “Sample Size,” “Mean,” “Standard Deviation,” and “Standard Error.” The first row reads “Placebo,” 42, -0.672, 0.161, 0.0280. The second row reads “Milk Powder,” 42, -0.184, 0.189, 0.0292. The third row reads “Calcium Pill,” 42, -0.179, 0.181, 0.0279. The last row reads “Calcium Pill Plus Exercise,” 42, 0.280, 0.330, 0.0509. Beneath the table is the box plot, labeled “Bone Density (% Change)” on the horizontal axis, with “Placebo,” “Milk Powder,” “Calcium Pill,” and “Calcium Pill Plus Exercise” on the vertical axis. For Placebo, the low point is at approximately -1 and the high point is at approximately -0.3. The low end of the box is at approximately -0.8, the high end is at approximately -0.6, and the middle line is at approximately -0.7. There is also a point at approximately -0.2. For Milk Powder, the low point is at approximately -0.45 and the high point is at approximately 0.3. The low end of the box is at approximately -0.35, the high end is at approximately -0.05, and the middle line is at approximately -0.25. For Calcium Powder, the low point is at approximately -0.55 and the high point is at approximately 0.2. The low end of the box is at approximately -0.3, the high end is at approximately 0, and the middle line is at approximately -0.2. For Calcium Power Plus Exercise, the low point is approximately -0.45 and the high point is approximately 0.75. The low end of the box is at approximately 0.05, the high end is at approximately 0.5, and the middle line is at approximately 0.35. There are also points “y bar sub 1” at approximately -0.7, “y bar sub 2” and “y bar sub 3” at approximately -0.2, and “y bar sub 4” at approximately 0.3. A comparison between a healthy bone and osteoporosis. The healthy bone shows lots of white lines on it, while the osteoporosis bone shows less. A box plot with A, B, and C on the vertical axis. For A, the low point is at approximately 8 and the high point is at approximately 12. The low end of the box is at approximately 10, the high end is at approximately 11.4, and the middle line is at approximately 10.9. For B, the low point is at approximately 7 and the high point is at approximately 10. The low end of the box is at approximately 7.8, the high end is at approximately 9.3, and the middle line is at approximately 8.5. For C, the low point is at approximately 3 and the high point is at approximately 12. The low end of the box is at approximately 5.4, the high end is at approximately 9.8, and the middle line is at approximately 7.6. There is a point labeled “y bar sub 1” at approximately 10.8, another labeled “y bar sub 2” at approximately 8.4, and one more labeled “y bar sub 3” at approximately 7.6.