Preparing for the next class
In the next in-class activity, you will need to identify the right types of data for an ANOVA, determine if ANOVA groups are independent random samples, and determine if groups have similar levels of variability.
In trying to understand when it is appropriate to use an ANOVA, there are three main conditions we should consider:
- Is it the right type of data?
- Are the groups independent random samples?
- Do the groups have similar levels of variability?
An ANOVA also requires that the data within each group be normally distributed, but testing for that is outside the scope of this course.
Let’s look at each condition in more detail.
An ANOVA only works if the factor of interest is categorical data, the response variable is numeric and continuous, and the mean of the response variable is the parameter of interest. Remember that categorical data are qualitative data that have no inherent ranking or order. Basically, in an ANOVA, we are interested in comparing the mean of the response variable to more than two independent groups of the factor of interest.
Question 1
1) Which of the following variables are categorical data? There may be more than one correct answer.
- a) Brand of shoes
- b) Body weight in pounds
- c) Age in years
- d) City of residence
- e) Outdoor temperature in degrees Celsius
- f) Type of medication
Hint: Look for data that will be separated by categories rather than measured in numbers.
Question 2
2) Which of the following variables are numeric and continuous data? There may be more than one correct answer.
- a) Hours of TV watched
- b) Body weight in pounds
- c) Age in days
- d) Telephone number
- e) Body temperature in degrees Fahrenheit
- f) Type of diet
Hint: Look for data measured in numbers.
Question 3
3) Which of the following pairings contain the right kind of data for an ANOVA? There may be more than one correct answer.
- a) Factor of interest: type of medication, response variable: blood pressure b) Factor of interest: body fat percentage, response variable: risk of heart attack
- c) Factor of interest: water temperature, response variable: frequency of coral bleaching events
- d) Factor of interest: television show, response variable: income earned per year
- e) Factor of interest: high school attended, response variable: location of current home
- f) Factor of interest: college degree earned, response variable: annual income
Hint: The factor of interest should be categorical, and the response variable should be numeric.
The groups being compared using an ANOVA need to be independent random samples or randomly assigned groups in an experiment. Consider the following examples.
Question 4
4) Suppose an animal rescue group wants to determine the best kind of food to help undernourished animals gain weight. The rescue randomly divides a group of dogs into four groups and feeds a different type of food to each group. They then track weight gain over time. Which of the following statements is the best evaluation of the groups?
- a) The groups are not independent, so an ANOVA is not appropriate.
- b) The groups are independent, randomly assigned experimental groups, so an ANOVA is appropriate.
- c) The groups are assigned correctly, but the type of data being collected is not appropriate for an ANOVA.
Hint: Are the groups randomly assigned?
Question 5
5) Suppose a high school principal wants to evaluate the impact of student interests on student academic performance. The principal compares the average GPAs of the students in the chess club, marching band, soccer team, and student government association. Which of the following statements is the best evaluation of the groups?
- a) The groups are not randomly selected and there could be overlap between the groups, so an ANOVA is not appropriate.
- b) The groups are independent, randomly selected groups, so an ANOVA is appropriate.
- c) The groups are assigned correctly, but the type of data being collected is not appropriate for an ANOVA.
Hint: Is each group an independent random sample?
The groups being compared should have equal or similar variability within their groups. There are formal tests that can be used to assess the similarity of variability among ANOVA groups, but they are beyond the scope of this course.
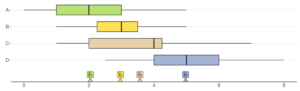
Instead, we can visually estimate variability by comparing boxplots of data or numerically comparing the standard deviations provided in summary statistics. Remember that the box in a boxplot visually represents the middle 50% of the data and is the size of the interquartile range. While this is not a measurement of the standard deviation, a boxplot allows us to visually compare the spread or variability in each group.
A good rule of thumb is that as long as the sample sizes are equal, the largest standard deviation can be no more than two times the smallest standard deviation. If the sample sizes are different, the standard deviations need to be really similar.
Question 6
6) Which of the following two boxplots represent the most similar variances? Hint: Look for boxplots that are similarly shaped.
Question 7
7) Using the previous rule of thumb, determine whether the equal variance assumption for ANOVA is reasonable for the following four studies. Suppose each of these studies has equal sample sizes across all groups.
| Study # | Smallest SD | Largest SD | Similar variability? |
| 1 | 3.06 | 3.79 | Yes |
| 2 | 0.22 | 2.54 | No |
| 3 | 1.57 | 3.32 | No |
| 4 | 2.39 | 4.16 | Yes |
Hint: The largest SD should be no more than two times the smallest SD.
Looking ahead
Our in-class activity will use osteoporosis research as an example. Explore the information found at https://medlineplus.gov/osteoporosis.html and be ready to discuss risk factors, prevention, and treatment of the disease.
