| Comparison | Difference Compared
(Part A) |
Adjusted Confidence Interval (Part B) |
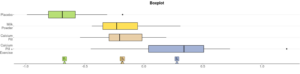
| Placebo vs. Milk Powder | (0.62, 0.36) | |
| Placebo vs. Calcium Pill | (0.62, 0.36) | |
| Placebo vs. Calcium Pill + Exercise | ||
| Milk Powder vs. Calcium Pill | ||
| Milk Powder vs. Calcium Pill + Exercise | ||
| Calcium Pill vs. Calcium Pill + Exercise | (0.59, 0.33) |
| Significantly Different Mean Bone Density | NOT Significantly Different Mean Bone Density |
| Placebo vs. Milk Powder | |
| Sterillium | PureHands | Lifebuoy | Dettol |
| 15.67 | 8.7 | 9.95 | 7.48 |
| 16.79 | 8.41 | 10.16 | 7.82 |
| 15.69 | 8.37 | 10.15 | 9.56 |
| 15.67 | 8.21 | 9.96 | 8.16 |
| 14.99 | 6.66 | 10.51 | 7.71 |
| 14.87 | 6.94 | 8.52 | 9.12 |
| 16.07 | 7.48 | 8.23 | 7.68 |
| 14.18 | 6.7 | 11.09 | 8.61 |
| 15.38 | 6.93 | 8.89 | 7.71 |
| 16.3 | 8.56 | 8.06 | 8.5 |
| A | B | C | D |
| 59 | 67 | 62 | 69 |
| 54 | 66 | 74 | 62 |
| 60 | 51 | 62 | 70 |
| 57 | 68 | 64 | 73 |
| 58 | 65 | 77 | 53 |
| 52 | 54 | 59 | 73 |
| 67 | 57 | 58 | 75 |
| 61 | 55 | 64 | 64 |
| 54 | 59 | 68 | 67 |
| 56 | 66 | 65 | 73 |
| 62 | 70 | 66 | 69 |
| 60 | 56 | 64 | 69 |
| 56 | 56 | 73 | 72 |
| 61 | 53 | 65 | 73 |
| 67 | 56 | 67 | 73 |
| 65 | 72 | 72 | 59 |
| 61 | 64 | 63 | 77 |
| 61 | 64 | 72 | 62 |
| 60 | 63 | 63 | 77 |
| 62 | 57 | 64 | 67 |
| Comparison | Probability of Committing
a Type I Error |
| Group A vs. Group B | 0.05 |
| Group A vs. Group C | |
| Group A vs. Group D | |
| Group B vs. Group C | |
| Group B vs. Group D | |
| Group C vs. Group D |
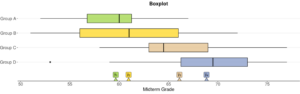
| Significantly Different Mean Midterm Grades | NOT Significantly Different Mean Midterm Grades |
| Group A vs. Group C | Group A vs. Group B |
| Skill or Concept: I can . . . | Questions to check your understanding | Rating from 1 to 5 |
| Understand the limitations of the conclusions from the F-test in an ANOVA. | 1 | |
| Identify the null and alternative hypotheses for all pair-wise comparisons. | 2–4 | |
| Use technology to perform a two-sample t-test. | 5, 6 | |
| Identify the probability of type I errors and issues that arise with multiple comparisons. | 7, 8 | |
| Use adjusted confidence intervals to conduct all pair-wise tests and make conclusions about significant differences. | 9, 10 |

ANOVA Table:
| Source | df | Sum of Squares | Mean Square | F Statistic | P-value |
| Group | 3 | 1122 | 374 | 12.46 | <0.0001 |
| Error | 76 | 2282 | 30.02 | ||
| Total | 79 | 3404 |
| Comparison | Estimated Difference In Means | Standard Error | t Statistic | P-value | Lower Bound | Upper Bound |
| Group A vs. Group B | -1.30 | 1.73 | -0.75 | 0.45 | -4.75 | 2.15 |
| Group A vs. Group C | -6.45 | 1.73 | -3.72 | 0.00 | -9.90 | -3.00 |
| Group A vs. Group D | -9.20 | 1.73 | -5.31 | 0.00 | -12.65 | -5.75 |
| Group B vs. Group C | -5.15 | 1.73 | -2.97 | 0.00 | -8.60 | -1.70 |
| Group B vs. Group D | -7.90 | 1.73 | -4.56 | 0.00 | -11.35 | -4.45 |
| Group C vs Group D | -2.75 | 1.73 | -1.59 | 0.11 | -6.20 | 0.70 |
| Comparison | Estimated Difference in Means | Standard Error | t Statistic | Multiplicity Adjusted P-value | Lower Bound | Upper Bound |
| Group A vs. Group B | -1.30 | 1.73 | -0.75 | 0.88 | -5.85 | 3.25 |
| Group A vs. Group C | -6.45 | 1.73 | -3.72 | 0.00 | -11.00 | -1.90 |
| Group A vs. Group D | -9.20 | 1.73 | -5.31 | 0.00 | -13.75 | -4.65 |
| Group B vs. Group C | -5.15 | 1.73 | -2.97 | 0.02 | -9.70 | -0.60 |
| Group B vs. Group D | -7.90 | 1.73 | -4.56 | 0.00 | -12.45 | -3.35 |
| Group C vs. Group D | -2.75 | 1.73 | -1.59 | 0.39 | -7.30 | 1.80 |
- pair-wise comparisons
- comparisons between two things.
- data snooping
- showing only the comparisons you want to show based on the boxplot, also called data fishing.
- family-wise error rate
- the probability of rejecting at least one of the true null hypotheses.
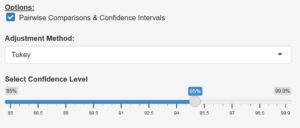
- Tukey method
- a method that adjusts the length of the confidence interval (to ensure an overall level of confidence) and the P-value (to ensure an overall significance level for all pair-wise comparisons).
