| Table A | You Win (1,2) | Tie (3,4) | You Lose (5,6) |
| Number of Rolls | 2 | 4 | 4 |
| Table B | You Win (1,2) | Tie (3,4) | You Lose (5,6) |
| Number of Rolls | 200 | 400 | 400 |
| Table C | You Win (1,2) | Tie (3,4) | You Lose (5,6) |
| Number of Rolls | 332 | 334 | 334 |
| Table D | You Win (1,2) | Tie (3,4) | You Lose (5,6) |
| Number of Rolls | 311 | 342 | 347 |
| For Table A | Expected Count | Observed Count | |
| You Win (1, 2) | 2 | ||
| Tie (3, 4) | 4 | ||
| You Lose (5, 6) | 4 |
| For Table B | Expected Count | Observed Count | |
| You Win (1, 2) | 200 | ||
| Tie (3, 4) | 200 | ||
| You Lose (5, 6) | 400 |
| Table A | Table B | Table C | Table D | |
| Chi-Square | 0.008 | 2.28 |
| County | Population Size |
| Queens | 2,287,000 |
| Bronx | 1,435,000 |
| Westchester | 968,000 |
| County | Queens | Bronx | Westchester |
| Observed Count | 204 | 132 | 164 |
| Location | Chicago | New York | Boston | L.A. | Houston |
| Number of baskets | 29 | 35 | 33 | 36 | 23 |
| Gender | Non-Binary | Female | Male |
| Proportion | 0.08 | 0.43 | 0.49 |
| Gender | Non-Binary | Female | Male |
| Proportion | 4 | 48 | 68 |
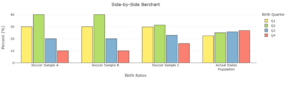
| Quarter | Quarter 1
(Jan. – March) |
Quarter 2
(April – June) |
Quarter 3
(July – Sept.) |
Quarter 4
(Oct. – Dec.) |
| Proportion of births in Italy | 22.48% | 24.98% | 25.74% | 26.80% |
| Sample A | Quarter 1
(Jan. – March) |
Quarter 2
(April – June) |
Quarter 3
(July – Sept.) |
Quarter 4
(Oct. – Dec.) |
| Observed number of soccer players | 3 | 4 | 2 | 1 |
| Sample B | Quarter 1
(Jan. – March) |
Quarter 2
(April – June) |
Quarter 3
(July – Sept.) |
Quarter 4
(Oct. – Dec.) |
| Observed number of soccer players | 3,000 | 4,000 | 2,000 | 1,000 |
| Sample C | Quarter 1
(Jan. – March) |
Quarter 2
(April – June) |
Quarter 3
(July – Sept.) |
Quarter 4
(Oct. – Dec.) |
| Observed number of soccer players | 507 | 534 | 389 | 273 |
| Sample A | Sample B | Sample C | |
| Chi-Square | 2.34 | 2,336 | 147 |
| Skill or Concept: I can . . . | Questions to check your understanding | Rating from 1 to 5 |
| Calculate the value of a chi-square test statistic and explain what it means in the context of a claim. | 2–4 | |
| Write the null and alternative hypotheses of a chi-square test for goodness of fit. | 1 |