
Question 1
1) Is itimportant to keep track of this information? Explain.Objectivesfor the activityYouwill understand:The chi-square test for independence has its limitations,but it may be possible to use Fisher’s Exact Test instead.Youwill be able to:Check the conditions for Fisher’s Exact Test. Use Fisher’s Exact Test to determine whether there is a relationship between two qualitative binary variables.
| Least concern | Near threatened | Vulnerable | Endangered | Critically endangered | |
| Plants in forest, subarctic | 33 | 15 | 3 | 3 | 1 |
| Plants in grassland, subarctic | 27 | 10 | 4 | 1 | 0 |
| Least concern | Near threatened | Vulnerable | Endangered | Critically endangered | |
| Plants in forest, subarctic | 34.0 | 14.2 | 4.0 | 2.3 | 0.57 |
| Plants in grassland, subarctic | 26.0 | 10.8 | 3.0 | 1.7 | 0.43 |
Question 2
2) Based onthetable, do you think it would be appropriate to perform a chi-square test for independence to determine if there is evidence of anassociation between where the plant lives and what its extinction level is? Explain.
Question 3
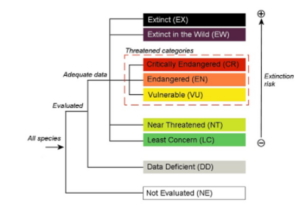
3) What would be a good way to combine some of the categoriesgiven the structure of the IUCN Red List? Refer to the figure. Note from the figure that the classifications Critically Endangered, Endangered,and Vulnerable are considered to be Threatened categories.
| Least concern | Near threatened | Threatened | |
| Plants in forest, subarctic | 33 | 15 | 7 |
| Plants in grassland, subarctic | 27 | 10 | 5 |
Question 4
4) Do you think it would be appropriate to perform a chi-square test for independence to determine if there is evidence of an association between where the plant lives and what its extinction level is? If so, conduct the testand write your conclusion.
| Least concern | Near threatened | Vulnerable | Endangered | Critically endangered | |
| Plants in forest, subantarctic | 20 | 10 | 2 | 1 | 0 |
| Plants in grassland, subantarctic | 12 | 7 | 2 | 1 | 0 |
Question 5
5) In this study, there are two variables: where the subantarctic plants growand what their extinction classificationsare. Do you think it would be appropriate to perform a chi-square test for independence to determine if there is evidence of an association between where the plant lives and what its extinction level is? Explain.
| Least concern | Near threatened | Threatened | |
| Plants in forest, subantarctic | 20 | 10 | 3 |
| Plants in grassland, subantarctic | 12 | 7 | 3 |
Note that while we are unable to use the chi-square test for independence, we can use Fisher’s Exact Test. This test can be done on a 2×2 contingency table when the expected frequencies do not meet the conditions for the chi-square test. For Fisher’s Exact Test, we require a simple random sample from the population and two categorical variables, each with two possible values. This will result in a 2×2 contingency table.
Question 6
6) Fill in the following 2×2 table.
| Least concern | Threatened levels | |
| Plants in forest, subantarctic | ||
| Plants in grassland, subantarctic |
The null and alternative hypotheses for Fisher’s Exact Test mirror those for the test for independence. Much like the other hypothesis tests, it uses a P-value to decide if there is evidence that the two variables are not independent. The P-value is calculated as the exact probability of observing cell counts that are as inconsistent with the hypotheses of independence as the counts in the table that were constructed from the sample data. The probability calculated is beyond the scope of what is covered in this course, but fortunately we can rely on technology to obtain calculations for us. In the end, remember that the smaller the P-value is, the stronger the evidence is against the null hypothesis.
