House prices fluctuate over time and are impacted by several variables. There are both internal variables (characteristics of the house) and external variables (the economy) that can impact house prices. It is even possible for two identical houses to sell at different prices.

Question 1
1) What are some other things that might impact the price of a house?
Previously, you learned that there are several conditions that must be met in order to analyze data using linear regression. Similarly, in order to conduct a hypothesis test for the significance of slope, you will need to verify those same conditions. Recall from In-Class Activity 6.D that when a linear regression is appropriate, the value of the residuals will be randomly scattered around 0. In other words, some residuals will be positive (observed value above the line on the residual plot) and some will be negative (observed value below the line on the residual plot). We should not see a systematic pattern (e.g., all above in order then all below in order). In particular, we should worry about the appropriateness of the model if we notice the following red flags:
•Red Flag 1: The trend in the scatterplot is nonlinear, indicating that the relationship between the explanatory variable and the response variable is not modeled well by a line. The residuals tend to have a pattern.
•Red Flag 2: The observed values are further and further away from the line of best fit for a portion of the data. In other words, the errors are not consistent for all values of the explanatory variable. The size of the residuals tends to increase or decrease as the value of the explanatory variable increases. When this happens, it can be hard to get a handle on the accuracy of the model because the standard deviation of the residuals is not constant over the values of the independent variable. Formally, to conduct a hypothesis test for the slope, we require: o A simple random sample o For any given value of 𝑥, the residuals have a mean of 0(Red Flag 1)o The standard deviation of the residuals is the same at all values of 𝑥(RedFlag 2)oFor any given value of 𝑥, the residuals follow a normal distribution.
Question 2
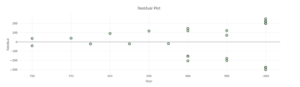
2) A random sample of 21 apartments all located in the same zip code is observed. The sizes(in square feet) and the rents(per month) are recorded. Consider the following residual plot. Would it be appropriate to do a hypothesis test for significance of slope? Explain.
Question 3
3) A random sample of 34 houses all located in the same zip code is for sale. The house sizes (in square feet) and the house prices (in dollars) are recorded.
Part A: Are the variables qualitative or quantitative?
Part B: What is the explanatory variable?
Part C: What is the response variable?
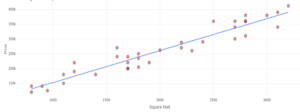
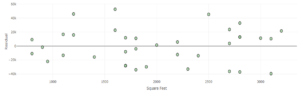
The random sample of 34 house prices and house sizes (square feet) was collected in Saratoga, Florida. Use the following scatterplot (Figure 1) and residual plot (Figure 2) to answer the questions that follow.
Question 4
4) A family wants to put their house up for sale and, using this set of data, they want to know if there is a useful linear relationship between the size and price of a house in their zip code to help them predict the price of their home.
Part A: Does the scatterplot appear to show a linear pattern?
Part B: To carry out a hypothesis test for the significance of slope, determine whether the conditions for fitting a linear regression line have been met.
At the 5% significance level, use Parts C through E to determine whether there is convincing evidence to conclude that there is a useful linear relationship between the size and price of a house in this zip code.
Part C: Write the hypothesis in symbols and in complete sentences.
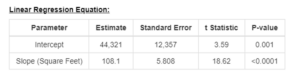
Part D: Use the following output to determine the value of the test statistic and the P-value.
Part E: Will the null hypothesis be rejected? Write your conclusion in a complete sentence.