Preparing for the next class
In the next in-class activity, you will need to identify the difference between the sample slope of the line of best fit and the population slope, understand the relationship between the correlation coefficient and the slope of a regression line, and write the hypotheses and obtain a test statistic and P-value for a test for significance of slope.In In-Class Activities 5.A and 5.B, we used scatterplots to visualize the relationship between two quantitative variables and the correlation coefficient, 𝑟,to describe the strength and direction of the linear relationship between the bivariate variables. Then, in In-Class Activities 6.A and 6.B, we modeled that relationship using a line of best fit given by 𝑦̂=𝑎+𝑏𝑥.
Question 1
1) Consider the following scatterplot describing the relationship between the weight of a car and its gas mileage for a sample of cars.
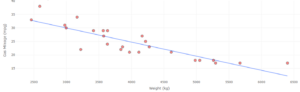
Part A: Is the linear correlation coefficient, 𝑟, positive, negative, or approximately 0? Hint: Note that the values of gas mileage follow a general decreasing pattern as the weights of the cars increase.
Part B:Is the value of the slope of the given line, 𝑏, positive, negative, or approximately 0?
Part C: Is there a reasonably strong linear relationship between the weight and gas mileage of a vehicle? Explain.
Question 2
2) Consider the following scatterplot describing the relationship between fuel efficiency and various steady driving speeds.
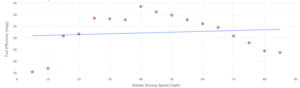
Part A: Is the linear correlation coefficient,𝑟,positive, negative, or approximately 0? Hint: Note that the values of fuel efficiency begin to increase as the driving speeds increase but then start to decrease.
Part B: Is the value of the slope of the given line positive, negative, or approximately 0?
Part C: When the slope of a line of best fit is approximately 0, do you think that we can say there is a linear relationship between two variables? Answer using a full sentence. Hint: Is one variable consistently increasing/decreasing as the other increases?
Question 3
3) Go to the DCMPLinear Regression tool at https://dcmathpathways.shinyapps.io/LinearRegression/. Select the dataset “Cereals:Sodium & Sugar.”
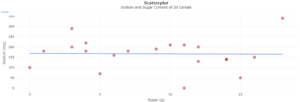
Part A: What is the value of the linear correlation coefficient,𝑟?
Part B:What is the value of 𝑏, the slope of the line of best fit?
Part C: Interpret the slope,𝑏, in context.
Part D: Is there a reasonably strong linear relationship between sugar and sodium in cereal? Explain.
In general, the sign of 𝑟(positive, negative, or 0) will be the same as the sign of 𝑏. This tells us that in studying and understanding the correlation coefficient, we simultaneously have information about the slope of the line of best fit.When the line of best fit is estimated, the slope, 𝑏, is calculated using sample data. The slope, 𝑏,is an estimate of the slope of the population regression line,𝛽1. This is similar to the relationship between the sample mean, 𝑥̅, and the population mean,𝜇, that we previously studied.
Question 4
4) Is 𝛽1 a parameter or a statistic? Hint: Recall from Preview Assignment 9.A that a statistic describes a characteristic of a sample and a parameter describes a characteristic of a population.
We want to conduct a hypothesis test to find out whether or not two quantitative variables have a significant linear relationship. When two variables do NOT have a significant linear relationship, the true value of the slope of the population line is 0:𝛽1=0.That is, the population regression line is a horizontal line, and the value of𝑦in the simple linear regression model does not depend on𝑥. To carry out a hypothesis test for significance of slope, often referred to as a model utility test, we will test the following: Null hypothesis-𝐻0:𝛽1=0vs.Alternative hypothesis-𝐻𝐴:𝛽1≠0
Question 5
5) Determine whether this statement is true or false: The null hypothesis 𝐻0:𝛽1=0can be interpreted as “There is no linear relationship between the variables.”
In In-Class Activity 6.E, you analyzed the “Tomatometer” data. These data came from the movie ratings website Rotten Tomatoes (rottentomatoes.com). On this website, movie critics write reviews, and regular moviegoers submit ratings (1–5 stars) for movies and TV shows. We focused on 125 movies from the website and the following variables.•tomatometer: The “Tomatometer” score calculated as the percentage of professional movie and TV critics who write positive reviews for the movie•audience_score: The percentage of the general public (regular moviegoers) who rate the movie 3.5 stars or higher (out of 5 stars) In that activity, you estimated aline of best fit to predict how the general public (including you and your friends) would like a movie based on what the critics think. It was determined in that activitythat a linear regression was appropriate.Note:You should always check the appropriateness of the linear model before conducting a hypothesis test.
Question 6
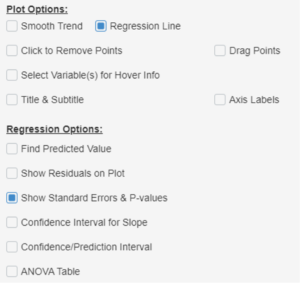
6) Now let’s do this more formally. At the 5% significance level, determine if there is a significant linear relationship between the critics’ ratings and the audience scores. Go back to the DCMP Linear Regression tool, select the dataset “Movie Ratings,”and select the following under“Plot Options:”
Part A: What is the null hypothesis? Hint: What will the value of the slope be if there is no linear relationship?
Part B: What is the alternative hypothesis? Hint: If 𝛽1does equal 0, that means there 𝑖𝑠𝑛𝑜linear relationship. So how would 𝛽1compare to 0if there was a linear correlation? In In-Class Activity 13.B, you used the following test statistic to conduct a one-sample hypothesis test for the mean with 𝐻0:𝜇=𝜇0:. 𝑡=𝑥̅−𝜇0[std. error of 𝑥̅]=𝑥̅−𝜇0𝑠/√𝑛The slope of the population line, 𝛽1, similarly follows a tDistribution. Thus, the test statistic to test 𝐻0:𝛽1=0is: 𝑡=b−0[std. error of b]=𝑏𝑆𝐸𝑏
Part C: The hypothesis test for significance of slope is a t-test. Using the output from the data analysis tool, identify the test statistic and record it here. Hint: Remember that we are doing inference on slope, not intercept.
Part D: Identify the P-value from the data analysis tool output. Hint: Remember that we are doing inference on slope, not intercept.
Part E: Determine whether this statement is true or false: At the 5% significance level, we have convincing evidence that there is a linear relationship between the critics’ score (Tomatometer) and the audience score.
Part F: Determine whether this statement is true or false: The linear model between the critics’ score (Tomatometer) and the audience score is useful.
