| Source | Df | Sum sq | Mean sq | F value |
| Group | 2 | 614.6 | 307.3 | |
| Error | 69 | 3911 | 56.681 | |
| Total | 71 | 4525.6 |
| Source | Df | Sum sq | Mean sq | F value |
| Group | 2 | 36.0 | 18.0 | |
| Error | 21 | 134.6 | 6.41 | |
| Total | 23 | 170.6 |
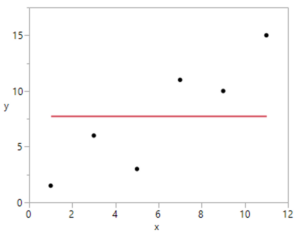
| SSTotal = 0 | SSRegression = 0
(but SSTotal 0) |
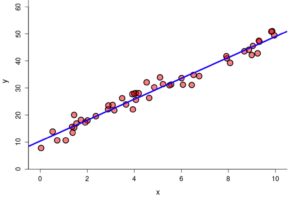
SSResiduals = 0
(but SSTotal 0) |
|
|
| Source | Df | Sum sq | Mean sq | F value |
| Regression | ||||
| Residuals | ||||
| Total |
| Source | Df | Sum sq | Mean sq | F value |
| Regression | ||||
| Residuals | ||||
| Total |
| Source | Df | Sum sq | Mean sq | F value |
| Regression | 2365.0 | |||
| Residuals | 525.1 | |||
| Total | 2890.1 |
| Source | Df | Sum sq | Mean sq | F value |
| Group | 2 | 177.4 | ||
| Error | 27 | 5715.0 | ||
| Total | 29 | 5892.4 |
| Skill or Concept: I can . . . | Questions to check your understanding | Rating from 1 to 5 |
| Use an ANOVA table to organize sums of squares and calculate an F-statistic. | 1 and 2 | |
| Interpret the coefficient of determination () in context. | 3 | |
| Use appropriate symbols to represent sample means, actual values, and predicted values. | 4 and 5 |

Glossary
- complex fraction
- a fraction in which the numerator and/or the denominator include fractions.
