| Skill or Concept: I can . . . | Questions to check your understanding | Rating from 1 to 5 |
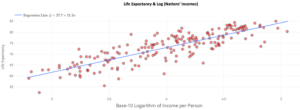
| Use technology to calculate a regression equation. | 1 | |
| Calculate predictions from the regression line. | 2 | |
| Use technology to calculate confidence intervals for the mean response and prediction intervals for individuals. | 3 | |
| Identify the appropriate type of interval based on a given situation. | 4 | |
| Compare confidence and prediction intervals. | 5 |

| Exponent | Exponential expression | Equivalent expression using multiplication and division | Evaluated expression |
| 4 | 2 2 2 2 | 16 | |
| 3 | |||
| 2 | |||
| 1 | |||
| 0 | |||
| 1 | |||
| 2 | |||
| 3 | |||
| 4 |
| Original number | 1293 | 5 | 0 | 0.4 | 1 | 4.76 | 33 | 492.1 | 2084 |
| Number squared |
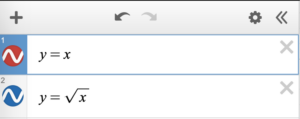
| Original number | Positive square root of number |
| 1293 | |
| 5 | |
| 0 | |
| 0.4 | |
| 1 | |
| 4.76 | |
| 33 | |
| 492.1 | |
| 2084 |
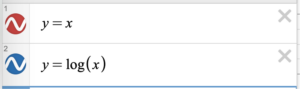
| Original number | Base 10 logarithm |
| 1293 | |
| 5 | |
| 0 | |
| 0.4 | |
| 1 | |
| 4.76 | |
| 33 | |
| 492.1 | |
| 2084 |
| Skill or Concept: I can . . . | Questions to check your understanding | Rating from 1 to 5 |
| Evaluate mathematical expressions by squaring numbers, taking the square roots of numbers, and taking the logarithms of numbers. | 1, 6, 11 | |
| Describe trends in what happens to numbers when you square them, take their square roots, and take their logarithms. | 2–5, 7–10,
12–15 |
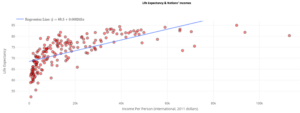
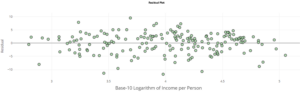
the labels have not transferred with the image


Glossary 16C
- confidence interval for the mean response
- a range of plausible values the mean value of the response variable takes when 𝑥 = 𝑥0.
- 𝑪% prediction interval for an individual response
- a range of plausible values of the response when an individual observation has a value of the explanatory variable equal to 𝑥0.
Glossary 16D
- base
- the number that is multiplied in an exponent.
- exponent
- the number of times to multiply the base by itself.
- squaring
- multiplying a number by itself once.
- cubing
- multiplying a number by itself twice.
- unit fraction
- a fraction whose numerator is 1 and whose denominator is a positive integer.
