| Variable | Description |
| ID | Identification number |
| Height | Height in centimeters (cm) |
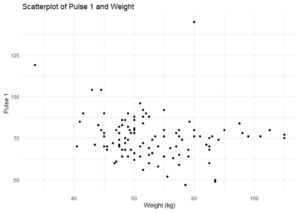
| Weight | Weight in kilograms (kg) |
| Age | Age in years |
| Sex | Male/female |
| Smokes | Are you a regular smoker? (yes/no) |
| Alcohol | Are you a regular drinker? (yes/no) |
| Exercise | What is your frequency of exercise? (low, moderate, high) |
| GroupAssignment | Whether the student ran or sat between the first and second pulse measurements |
| Pulse1 | First pulse measurement (rate per minute) |
| Pulse2 | Second pulse measurement (rate per minute) |
| Year | Year of class (1993–1998) |
| Variable name | Definition |
| id | Identification number of the student |
| female | Gender of the student (0 = male, 1 = female) |
| race | Ethnic background of the student (1 = Hispanic, 2 = Asian, 3 = Black, 4 = White) |
| ses | Socio-economic status of the student (1 = low, 2 = medium, 3 = high) |
| schtyp | School type (1 = public, 2 = private) |
| prog | Program type (1 = general, 2 = academic preparatory, 3 = vocational/technical) |
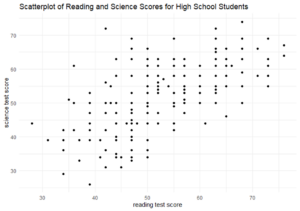
| read | Score from test of reading |
| write | Score from test of writing |
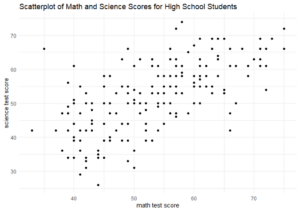
| math | Score from test of math |
| science | Score from test of science |
| socst | Score from test of social studies |
| Estimate | |
| Intercept | 11.61550 |
| math | 0.4172 |
| read | 0.36542 |
| Coefficients | Estimate |
| Intercept | 49.58930 |
| Age (yrs) | 0.16531 |
| Weight (lbs) | 0.22638 |
| Height (in) | 1.11680 |
| Variable | Description |
| ID | Identification number |
| Height | Height in centimeters (cm) |
| Weight | Weight in kilograms (kg) |
| Age | Age in years |
| Sex | Male/female |
| Smokes | Are you a regular smoker? (yes/no) |
| Alcohol | Are you a regular drinker? (yes/no) |
| Exercise | What is your frequency of exercise? (low, moderate, high) |
| GroupAssignment | Whether the student ran or sat between the first and second pulse measurements |
| Pulse1 | First pulse measurement (rate per minute) |
| Pulse2 | Second pulse measurement (rate per minute) |
| Year | Year of class (1993–1998) |
| Coefficients | Estimate |
| Intercept | 86.96948 |
| Weight | 0.17002 |
| Skill or Concept: I can . . . | Questions to check your understanding | Rating from 1 to 5 |
| Identify response and explanatory variables. | 1, 2, 7, 8 | |
| Write the equation of the line of best fit for simple linear regression. | 4 | |
| Interpret the slope in the context of the data. | 5 | |
| Interpret the coefficient of determination. | 6 | |
| Interpret a scatterplot of a response variable and one explanatory variable. | 3 |

Glossary
- multiple linear regression model
- a linear regression model with two or more explanatory variables.
- partial slopes
- the regression coefficients for explanatory variables in multiple linear regression.
