Preparing for the next class
In the next in-class activity, you will need to be able to identify response and explanatory variables, write the equation of the line of best fit for simple linear regression, and interpret the coefficient of determination and slope in the context of data.
Background on data
Students in an introductory statistics class at The University of Queensland participated in a simple experiment.[1] The students took their own pulse rates. They were then asked to flip a coin. If the coin came up heads, they were to run in place for one minute. Otherwise, they sat for one minute. Afterward, everyone took their pulse rates again. The pulse rates and other physiological and lifestyle data were recorded in a dataset called “PulseRate.” The dataset is contained in the spreadsheet DCMP_STAT_17A_PulseRate. There are a total of 110 observations and 11 variables about the experiment. The variables in the dataset are:
| Variable | Description |
| ID | Identification number |
| Height | Height in centimeters (cm) |
| Weight | Weight in kilograms (kg) |
| Age | Age in years |
| Sex | Male/female |
| Smokes | Are you a regular smoker? (yes/no) |
| Alcohol | Are you a regular drinker? (yes/no) |
| Exercise | What is your frequency of exercise? (low, moderate, high) |
| GroupAssignment | Whether the student ran or sat between the first and second pulse measurements |
| Pulse1 | First pulse measurement (rate per minute) |
| Pulse2 | Second pulse measurement (rate per minute) |
| Year | Year of class (1993–1998) |
Questions 1–5: The first research question we are interested in exploring is, “What is the relationship between weight and first pulse measurement? Is weight a useful predictor of first pulse rate?”
Question 1
1) Based on the first research question, what are the response and explanatory variables?
a) Response variable = Pulse1, explanatory variable = Weight
b) Response variable = Pulse2, explanatory variable = Weight
c) Response variable = Weight, explanatory variable = Pulse1
d) Response variable = Weight, explanatory variable = Pulse2
Question 2
2) When creating a scatterplot to visually assess the relationship, which variable should be on the y-axis and which variable should beon the x-axis?
a) y-axis = Pulse1, x-axis = Weight
b) y-axis = Pulse2, x-axis = Weight
c) y-axis = Weight, x-axis = Pulse1
d) y-axis = Weight, x-axis = Pulse2
Question 3
3) Looking at the following scatterplot of Pulse 1and Weight, what type of relationship do you see between the two variables?
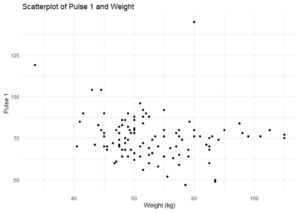
a) There is a strong, negative linear relationship between a student’s weight and their first pulse measurement.
b) There is a positive, linear relationship between a student’s weight and their first pulse measurement.
c) There is a weak, negative linear relationship between a student’s weight and their first pulse measurement.
Question 4
4) A simple linear regression model was fit to model the relationship between a student’s weight and pulse to answer the first research question. The coefficients of the equation for the lineof best fit are provided in the following table. Whichof the following modelscontainsthe correct equation?(In the equations given in the answer choices,𝑦is Pulse1).
| Coefficients | Estimate |
| Intercept | 86.96948 |
| Weight | 0.17002 |
b)𝑦̂= –0.17–86.97×weightc)𝑦̂= 86.97–0.17d)𝑦̂= 86.97+ 0.17×weight
Question 5
5) What is the correct interpretation of the slope?
a) For every one kg decrease in student weight, we predict a decrease by 86.97 in the first pulse measurement, on average.
b) For every one kg increase in student weight, we predict an increase by 0.17 in the first pulse measurement, on average.
c) For every one kg increase in student weight, we predict a decrease by 0.17 in the first pulse measurement, on average.
Question 6
6) The value of the coefficient of determination, 𝑅2,is 0.03789. What is the correct interpretation of the coefficient of determination?
a) About −0.195% of the variation in the first pulse measurement can be explained by its linear relationship with weight.
b) About 3.8%of the variationin the first pulse measurement can be explained by its linear relationship with weight.
c) About 3.8%of the variationin weight can be explained by its linear relationship with the first pulse measurement.
Questions 7 and 8:The second research question that we are interested in exploring is,“What is the relationship between weight and age on the first pulse measurement? Are weight and age useful predictors of the first pulse rate?”
Question 7
7) What is the response variable fort he second research question?
a) Pulse2
b) Pulse1
c) Weight
d) Age
Question 8
8) Is there more than one explanatory variable in the research question?
a) Yes
b) No
Question 9
9) Do you think a model that uses two predictor variables would explain more variation in a response variable than a model that just uses one? Explain. A linear regression model with two or more explanatory variables is called a multiple linear regression model.
- Wilson, R. J. (n.d.). Pulse rates before and after exercise. StatSci.org. http://www.statsci.org/data/oz/ms212.html ↵
