| Variable | Description |
| ID | Identification number |
| Height | Height in centimeters (cm) |
| Weight | Weight in kilograms (kg) |
| Age | Age in years |
| Sex | Male/female |
| Smokes | Are you a regular smoker? (yes/no) |
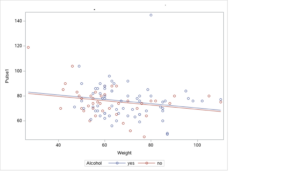
| Alcohol | Are you a regular drinker? (yes/no) |
| Exercise | What is your frequency of exercise? (low, moderate, high) |
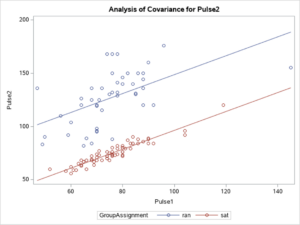
| GroupAssignment | Whether the student ran or sat between the first and second pulse measurements |
| Pulse1 | First pulse measurement (rate per minute) |
| Pulse2 | Second pulse measurement (rate per minute) |
| Year | Year of class (1993–1998) |
| Variable name | Definition |
| id | Identification number of the student |
| female | Gender of the student (0 = male, 1 = female) |
| race | Ethnic background of the student (1 = Hispanic, 2 = Asian, 3 = Black, 4 = White) |
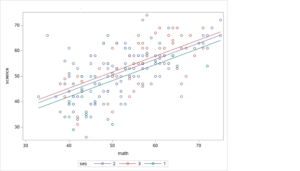
| ses | Socio-economic status of the student (1 = low, 2 = medium, 3 = high) |
| schtyp | School type (1 = public, 2 = private) |
| prog | Program type (1 = general, 2 = academic preparatory, 3 = vocational/technical) |
| read | Score from test of reading |
| write | Score from test of writing |
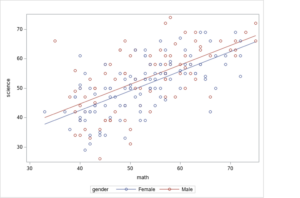
| math | Score from test of math |
| science | Score from test of science |
| socst | Score from test of social studies |
| id | schtyp | Indicator variable (public) |
| 30 | 1 | |
| 31 | 2 | |
| 32 | 1 | |
| 33 | 1 | |
| 34 | 2 |
| Coefficients | Estimate |
| Intercept | 18.12 |
| math | 0.66 |
| female – indicator variable (1 = female)* | 2.16 |
| Level | ses-medium
(1 = medium) |
ses-high
(1 = high) |
| ses = low | 0 | |
| ses = medium | 1 | |
| ses = high | 0 |
| Coefficients | Estimate |
| Intercept | 16.59 |
| math | 0.63 |
| ses-medium (1 = medium) | 2.08 |
| ses-high (1= high) | 3.32 |
| Variable | Description |
| ID | Identification number |
| Height | Height in centimeters (cm) |
| Weight | Weight in kilograms (kg) |
| Age | Age in years |
| Sex | Male/female |
| Smokes | Are you a regular smoker? (yes/no) |
| Alcohol | Are you a regular drinker? (yes/no) |
| Exercise | What is your frequency of exercise? (low, moderate, high) |
| GroupAssignment | Whether the student ran or sat between the first and second pulse measurements |
| Pulse1 | First pulse measurement (rate per minute) |
| Pulse2 | Second pulse measurement (rate per minute) |
| Year | Year of class (1993–1998) |
| ID | Alcohol
(Are you a regular drinker?) |
Indicator variable |
| 2 | Yes | |
| 3 | Yes | |
| 6 | Yes | |
| 10 | Yes | |
| 11 | Yes | |
| 18 | Yes | |
| 22 | No | |
| 26 | No | |
| 29 | Yes | |
| 30 | Yes |
| Coefficients | Estimate |
| Intercept | 86.776 |
| Weight | 0.176 |
| Alcohol indicator variable (1 = yes) | 1.011 |
| Parameter | Estimate |
| Intercept | 7.54680337 |
| Pulse1 | 0.88733028 |
| GroupAssignment = ran | 52.34616648 |
| Variable | Description |
| ID | Identification number |
| Height | Height in centimeters (cm) |
| Weight | Weight in kilograms (kg) |
| Age | Age in years |
| Sex | Male/female |
| Smokes | Are you a regular smoker? (yes/no) |
| Alcohol | Are you a regular drinker? (yes/no) |
| Exercise | What is your frequency of exercise? (low, moderate, high) |
| GroupAssignment | Whether the student ran or sat between the first and second pulse measurements |
| Pulse1 | First pulse measurement (rate per minute) |
| Pulse2 | Second pulse measurement (rate per minute) |
| Year | Year of class (1993–1998) |
| Skill or Concept: I can . . . | Questions to check your understanding | Rating from 1 to 5 |
| Calculate counts for a categorical variable using technology. | 1–4 | |
| Interpret graphical displays for categorical variables. | 5 and 6 |

Glossary
- indicator variable
- a binary variable with only two values: 0 and 1.
