Preparing for the next class
In the next in-class activity, you will need to be able to calculate counts for a categorical variable using technology and interpret graphical displays for categorical variables. Recall that students in an introductory statistics class at The University of Queensland participated in a simple experiment.[1] The students took their own pulse rates. They were then asked to flip a coin. If the coin came up heads, they were to run in place for one minute. Otherwise, they sat for one minute. Afterward, everyone took their pulse rates again. The pulse rates and other physiological and lifestyle data were recorded in a dataset called “PulseRate.” The variables in the dataset are:
| Variable | Description |
| ID | Identification number |
| Height | Height in centimeters (cm) |
| Weight | Weight in kilograms (kg) |
| Age | Age in years |
| Sex | Male/female |
| Smokes | Are you a regular smoker? (yes/no) |
| Alcohol | Are you a regular drinker? (yes/no) |
| Exercise | What is your frequency of exercise? (low, moderate, high) |
| GroupAssignment | Whether the student ran or sat between the first and second pulse measurements |
| Pulse1 | First pulse measurement (rate per minute) |
| Pulse2 | Second pulse measurement (rate per minute) |
| Year | Year of class (1993–1998) |
Questions 1–4: Go to the DCMPExplore Categorical Data tool for one categorical variable at https://dcmathpathways.shinyapps.io/EDA_categorical/. Open spreadsheet DCMP_STAT_17A_PulseRate so you can copy and paste the relevant columns into the data analysis tool by selecting “Enter Data: Individual Observations.”
Question 1
1) Using the variable Sex from the dataset, what is the number of males in the sample?
a) 51
b) 59
c) 110
d) 46
Hint: In the tool, choose “Individual Observations,” specify the variable name, and copy and paste the variable values from the spreadsheet into the data analysis tool.
Question 2
2) Delete all of the values for the previous variable. Using the variable Alcohol from the dataset, what is the percentage of students who are regular drinkers? Make sure to specify the variable name in the data analysis tool.
a) 68%
b) 42%
c) 62%
d) 38%
Question 3
3) Using the variable Smokes from the dataset, what is the number of students who do not regularly smoke?
a) 110
b) 11
c) 90
d) 99
Question 4
4) What is the percentage of students who smoke regularly?
a) 11%
b) 99%
c) 90%
d) 10%
Question 5
5) Using the following graphical display, what is the correct interpretation of the boxplot of the first pulse measurement by male/female?
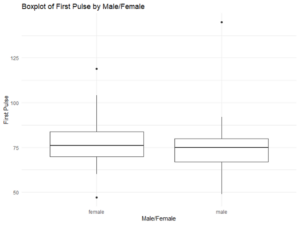
a) The median first pulse measurement for males and females is around 75 beats per minute.
b) The mean first pulse measurement for males and females is around 75 beats per minute.
c) The median first pulse measurement for males and females is around 100beats per minute.
d) The mean first pulse measurement for males and females is around 100 beats per minute.
Question 6
6) Using the following graphical display, what is the correct interpretation of the boxplot of the first pulse measurement by exercise frequency?
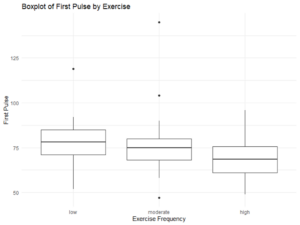
a) The median first pulse measurement is highest for low exercise frequency compared to moderate and high levels.
b) The median first pulse measurement is highest for high exercise frequency compared to low and moderate levels.
c) The median first pulse measurement is highest for moderate exercise frequency compared to low and high levels.
d) The median first pulse measurement is equal for all levels of exercise frequency.
- Wilson, R. J. (n.d.). Pulse rates before and after exercise. StatSci.org. http://www.statsci.org/data/oz/ms212.html ↵
