| Variable name | Definition |
| competitorname | The name of the Halloween candy |
| chocolate | Does it contain chocolate? |
| fruity | Is it fruit flavored? |
| caramel | Is there caramel in the candy? |
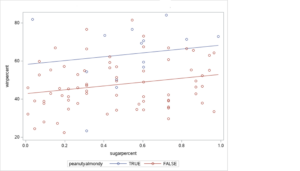
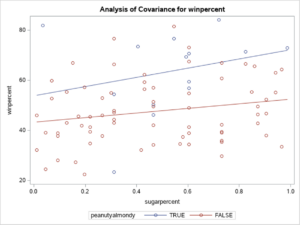
| peanutyalmondy | Does it contain peanuts, peanut butter, or almonds? |
| nougat | Does it contain nougat? |
| crispedricewafer | Does it contain crisped rice, wafers, or a cookie component? |
| hard | Is it a hard candy? |
| bar | Is it a candy bar? |
| pluribus | Is it one of many candies in a bag or box? |
| sugarpercent | The percentile of sugar it falls under within the dataset. |
| pricepercent | The unit price percentile compared to the rest of the set. |
| winpercent | The overall win percentage according to 269,000 matchups. |
| Parameter | Estimate | Standard error |
t-value | Pr > |t| |
| Intercept | 42.93 | 2.88 | 14.91 | <.0001 |
| peanutyalmondy = TRUE | 15.34 | 3.90 | 3.93 | 0.0002 |
| sugarpercent | 10.14 | 5.15 | 1.97 | 0.0523 |
| Parameter | Estimate | Standard error |
t-value | Pr > |t| |
| Intercept | 43.40 | 3.01 | 14.41 | <.0001 |
| peanutyalmondy = TRUE | 10.48 | 9.63 | 1.09 | 0.2799 |
| sugarpercent | 9.15 | 5.48 | 1.67 | 0.0985 |
| sugarpercentpeanutyalmondy = TRUE | 9.23 | 16.69 | 0.55 | 0.5818 |
| peanutyalmondy indicator variable value | Estimated model equation |
| peanutyalmondy 1 or TRUE | _________ ________ |
| peanutyalmondy 0 or FALSE | _________ ________ |
| LeadLevels | Elevation_Feet | Direction |
| 3.475 | 2000 | west |
| 3.359 | 2000 | west |
| 3.877 | 2000 | west |
| 4 | 2500 | west |
| 3.618 | 2500 | west |
| 2.644 | 2500 | west |
| 4.575 | 3000 | west |
| 8.6 | 3000 | west |
| 6.952 | 3000 | east |
| 4.349 | 3000 | east |
| Parameter | Estimate | Standard Error |
t-value | Pr > |t| |
| Intercept | 2.385 | 5.393 | 0.44 | 0.6598 |
| Direction = east | 3.201 | 7.670 | 0.42 | 0.6777 |
| Elevation_Feet | 0.002 | 0.002 | 0.84 | 0.4014 |
| Elevation_Feet * Direction = east | -0.001 | 0.003 | -0.44 | 0.6629 |
| Variable | Description |
| ID | Identification number |
| Height | Height in centimeters (cm) |
| Weight | Weight in kilograms (kg) |
| Age | Age in years |
| Sex | Male/female |
| Smokes | Are you a regular smoker? (yes/no) |
| Alcohol | Are you a regular drinker? (yes/no) |
| Exercise | What is your frequency of exercise? (low, moderate, high) |
| GroupAssignment | Whether the student ran or sat between the first and second pulse measurements |
| Pulse1 | First pulse measurement (rate per minute) |
| Pulse2 | Second pulse measurement (rate per minute) |
| Year | Year of class (1993–1998) |
| Skill or Concept: I can . . . | Questions to check your understanding | Rating from 1 to 5 |
| Interpret the trend of a linear regression model with two explanatory variables. | 5, 6, 8 | |
| Visualize an interaction between a continuous explanatory variable and a categorical explanatory variable using a scatterplot. | 1–4
7, 9 |

Glossary
- interaction
- when an explanatory variable has a different effect on the response variable.
- interaction term
- a variable that represents an interaction between two variables.
