17C InClass

Question 1

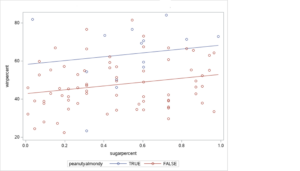
1) From the candy rankings dataset, do you think the effect of sugar percentile on win percentage differs depending on whether or not the candy contains peanuts, peanut butter, or almonds?

You will continue using the candy rankings dataset in this in-class activity. The dataset is about information from 269,000 matchups between candies to find the candy that most people prefer. The dataset contains information about 85 candies and 12 variables. The dataset is contained in spreadsheet DCMP_STAT_17C_candy_rankings.The following is information about the variable names and definitions:
An assortment of sweets.

Credit: iStock/a_namenko

Variable name Definition
competitorname The name of the Halloween candy
chocolate Does it contain chocolate?
fruity Is it fruit flavored?
caramel Is there caramel in the candy?
peanutyalmondy Does it contain peanuts, peanut butter, or almonds?
nougat Does it contain nougat?
crispedricewafer Does it contain crisped rice, wafers, or a cookie component?
hard Is it a hard candy?
bar Is it a candy bar?
pluribus Is it one of many candies in a bag or box?
sugarpercent The percentile of sugar it falls under within the dataset.
pricepercent The unit price percentile compared to the rest of the set.
winpercent The overall win percentage according to 269,000 matchups.
Questions 2–5: We are interested in answering the following question,“Does the percentile of sugar and whether the candy contains peanuts, peanut butter, or almonds in it influence the overall average win percentage for the candy?”

Question 2

2) What is the response variable? Identify the variable name from the dataset.

Question 3

3) What are the explanatory variables? Identify the variable names from the dataset and whether they are categorical or continuous.

Question 4

4) The reference group of interest for the variable peanuty almondy is there is no peanuts, peanut butter, or almonds in the candy.
Part A: How many indicator variables are needed for the variable?
Part B: How would you define the values for the indicator variablepeanut,given the reference group of interest?

Question 5

5) Giventhe fitted model coefficients in thefollowingtable, consider theregression model that can answerthe question of interest.A scatterplot labeled “sugar percent” on the horizontal axis and “winpercent” on the y-axis. There is a legend titled peanutyalmondy showing that the blue line and points indicate TRUE and the red line and points indicate FALSE. The red dots are very spread out but arranged in a loosely linear pattern. The red line has a positive slope. The blue dots are also spread out in a loosely linear pattern and the blue line appears to have a similar slope to the red line, but is above it.

Parameter Estimate Standard
error
t-value Pr > |t|
Intercept 42.93 2.88 14.91 <.0001
peanutyalmondy = TRUE 15.34 3.90 3.93 0.0002
sugarpercent 10.14 5.15 1.97 0.0523
Elevation_Feet * Direction = east -0.001 0.003 -0.44 0.6629
Part A: What is the full equation for the model?
Part B: What is the equation of the model for acandy that contains peanuts, peanut butter, or almonds?Write it in the most simplified form.
Part C: What is the equation ofthe model for acandy that doesnotcontain peanuts, peanut butter, or almonds?

Question 6

6) What is the interpretation for the regression coefficient fora candy that contains peanuts, peanut butter,or almonds? Hint: What is the reference group for the interpretation?

Questions 7–10: We want to investigate whether the effect of sugar percentile on win percentage differs depending on whether or not the candy has peanuts, peanut butter, or almonds. In this case, we would want to investigate an interaction term.

Question 7

7) What additional term would need to be added to the multiple linear regression model? Define the additional term using variables from the dataset.

Question 8

8) Explain why or why not the question from the start of the activity (“Does the percentile of sugar and whether the candy contains peanuts, peanut butter, or almonds in it influence the overall average win percentage for the candy?”) differs from the statement under investigation.

Question 9

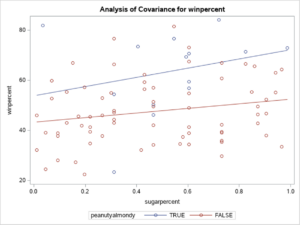
9) The new fitted model is presented in the following figure. How does this model differ from the one in Question 5?

A scatterplot labeled “sugar percent” on the horizontal axis and “winpercent” on the y-axis. There is a legend titled peanutyalmondy showing that the blue line and points indicate TRUE and the red line and points indicate FALSE. The red dots are very spread out but arranged in a loosely linear pattern. The red line has a positive slope. The blue dots are also spread out in a loosely linear pattern and the blue line has a steeper positive slope than the red line. It is also higher than the red line.

Question 10

10) Given the fitted model coefficients in the following table, consider the regression model that can answer the question of interest.
Parameter Estimate Standard
error
t-value Pr > |t|
Intercept 43.40 3.01 14.41 <.0001
peanutyalmondy = TRUE 10.48 9.63 1.09 0.2799
sugarpercent 9.15 5.48 1.67 0.0985
sugarpercentpeanutyalmondy = TRUE 9.23 16.69 0.55 0.5818
Part A: What is the full equation for the model?
Part B: Fill in the following table with the appropriate model equationsto see the interaction termsunpacked. Simplify your equation by combining like terms and simplifying.

peanutyalmondy indicator variable value Estimated model equation
peanutyalmondy  1 or TRUE  _________  ________
peanutyalmondy  0 or FALSE  _________ ________
Part C: What is the interpretation of sugarpercentfor a candy that has peanuts, peanut butter,or almonds?

Question 11

11) What would be the winpercentfor a candy that does not have peanuts, peanut butter,or almonds and has a sugarpercentof 0.84 (84%)?