Preparing for the next class
In the next in-class activity, you will need to understand how fuel efficiency is measured for electric cars, use technology to generate random numbers, and select a bootstrap sample and calculate its mean. We will be learning a new method for constructing a confidence interval for a population mean called a bootstrap confidence interval. Bootstrap confidence intervals can be used even if the conditions for a one-sample t confidence interval are not met. In this preview assignment, the dataset that will be used in the in-class activity will be introduced and we will learn about resampling, which is part of the process used to create a bootstrap confidence interval.For a gas-powered car, the usual way of measuring fuel efficiency is to report miles per gallon, which is abbreviated as “mpg.” This is how far the car can travel on a single gallon of gas. So, the greater the reported mpg value, the more efficient the car is and the less costly it is to operate. But electric vehicles don’t use gas, so how is the fuel efficiency measured for electric cars? One measure that is used by the Environmental Protection Agency(EPA)is the kilowatt hours per 100 miles rating, which is abbreviated as “kWh/100 miles.” The kWh/100 miles rating is the amount of electricity that is required to travel 100 miles.
Question 1
1) Let’s explore the efficiency of electric cars in more detail.
Part A: If you are looking for a gas-powered car, would you want the mpg rating to be high or low? Explain.
Part B: If you are looking for an electric car, would you want the kWh/100 milesrating to be high or low? Explain.
Part C: In March 2021, the U.S. Energy Information Administration reported that the average cost of electricity was 13.29 cents per kWh. The 2021 Chevrolet Volt has a kWh/100 miles rating of 29kWh/100 miles. Assuming the cost of electricity is 13.29 cents per kWh, what is the energy cost of driving this car 100 miles? What is the energy cost of driving this car 500 miles?
In the in-class activity, we will be working with a sample of kWh/100 miles ratings for 10 electric cars that were randomly selected from the population of all the 2021 models of electric cars sold in the United States, as reported by the EPA.The sample data are shown in the following table.
| Observation | Car model | kWh/100 miles |
| 1 | Porsche Taycan 4S Cross Turismo | 45 |
| 2 | Volkswagen ID.4 Pro S | 35 |
| 3 | Hyundai Kona Electric | 27 |
| 4 | Ford Mustang Mach-E RWD | 34 |
| 5 | Tesla Model S Performance | 35 |
| 6 | Tesla Model X Performance | 35 |
| 7 | Nissan Leaf SV/SL | 32 |
| 8 | Tesla Model S Plaid | 33 |
| 9 | Volkswagen ID.4 Pro | 34 |
| 10 | BMW i3s | 30 |
Part D: Calculate the mean kWh/100 miles rating for this sample of 10 electric cars.
In the in-class activity, we will learn a new way to construct confidence intervals that involves resampling from the data in a sample from a population. This involves selecting bootstrap samples. A bootstrap sample is a sample that is selected from the values in the original sample. The bootstrap sample is selected with replacement and the sample size is the same as the sample size of the original sample. We will see why it makes sense to do this in the in-class activity, so for now, we are just going to practice selecting a bootstrap sample from the sample of the 10 electric car kWh/100 miles ratings. To create a bootstrap sample from the original sample, we want to select a new sample of size 10 by sampling with replacement from the original sample. Notice that the observations in the original sample are numbered from 1 to 10. To select the bootstrap sample, we can generate 10 random numbers between 1 and 10 to identify which values are included in the bootstrap sample. Because we are sampling with replacement, we should expect that some of the random numbers generated may be repeated.
Question 2
2) Go to the random number generator at https://dcmathpathways.shinyapps.io/RandomNumbers/.
•Enter “1”in the “Choose Minimum” box and “10”in the “Choose Maximum” box.
•Enter “10”in the “How many numbers do you want to generate?” box.
•Select “Yes” for “Sample with Replacement?”
The screen should look like this: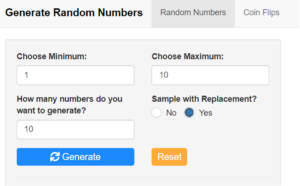
•Click on the “Generate” button, and the app will display the 10 numbers generated in the box labeled “Current Simulation.”
Part A: Record the 10 numbers you generated in the first column of the following table.
| Random number | kWh/100 miles |
Part B: Are any of the random numbers repeated? Is this surprising? Explain.
Part C: For each random number generated, go to the table with the original data and find the observation corresponding to that random number. (For example, if the random number generated is 7, thiscorresponds to the Nissan Leaf in the sample.) Record thekWh/100 miles rating for thecarcorresponding to thefirst random numberin the second columnof the previous table, andthen complete the table by entering the other kWh/100 miles ratings for the rest of the random numbers in thetable. You have just created a bootstrap sample!
Part D: Calculate the value of the sample mean for your bootstrap sample.
Part E: Select a second bootstrap sample and record your observations in the following table. Calculate the mean of your second bootstrap sample.
| Random number | kWh/100 miles |
Part F: Are the means for your two bootstrap samples equal? If not, why are they different?
Looking ahead In this preview assignment, you learned how fuel efficiency is measured for electric cars and produced two bootstrap samples. The in-class activity will explore how bootstrap samples are used to construct a bootstrap confidence interval for a population mean. Important: Bring your two bootstrap samples and the values of the two bootstrap sample means to class so that you can use them in the in-class activity.
