In the next preview assignment and in the next class, you will need to compare proportions using tables and segmented bar graphs.
Comparing Proportions
A Swedish longitudinal study investigated the use of herbal medicine products and food supplements among the elderly. In this study, researchers asked participants aged 60–96 years whether they use at least one herbal medicine product and if they use at least one food supplement. Data on sex and whether they use at least one food supplement for 1,380 study participants are summarized in the table below.[1]
| Take food supplement? | Male | Female | Total |
| Yes | 52 | 132 | 184 |
| No | 524 | 672 | 1,196 |
| Total | 576 | 804 | 1,380 |
Question 1
1) Use the table above to calculate the percentage of study participants who take food supplements and the percentage who do not take food supplements.
Question 2
2) Compute the sum of the two percentages you calculated in Question 1. Explain why your answer makes sense in the context of the survey.
Question 3
3) Now we will compare the proportions of study participants who takefood supplements between the two groups, males and females.
Part A: What proportion of males takefood supplements in this study?
Part B: What proportion of females takefood supplements in this study?
Part C: Use your answers from Parts A and B to determine which group hasa greaterproportion taking food supplements in this study, males or females.
Question 4
4) The segmented bar graph below summarizes these data.
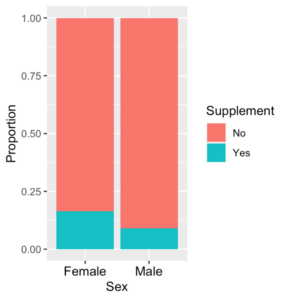
Part A: Explain how the height of the blue area in the left bar (representing the group of females who takesupplements)was calculated from the data in the table.
Part B: Explain how you can tell from the segmented bar graphwhich group in the study, males or females,has a larger proportion of people who takesupplements.
- Stjernberg, L., Berglund, J.,&Halling, A. (2006). Age and gender effect on the use of herbal medicine products and food supplements among the elderly. Scandinavian Journal of Primary Health Care, 24(1),50–55. https://www.tandfonline.com/doi/full/10.1080/02813130500475522 ↵
