During the COVID-19 pandemic, clinical trials were conducted to determine which factors may help reduce COVID-19 risk. One vitamin in particular, vitamin D, looked promising for reducing this risk. News headlines such as “Vitamin D Can Help Reduce COVID-19 Risks: Here’s How” started appearing in Fall 2020. But were these headlines valid? In this in-class activity, we will examine data from one study designed to determine if vitamin D may reduce the severity of illness if one does test positive for COVID-19.2
Question 1
1) How would you design a study to determine if vitamin D reducesthe risk of intensive care unit (ICU) admission due toCOVID-19?
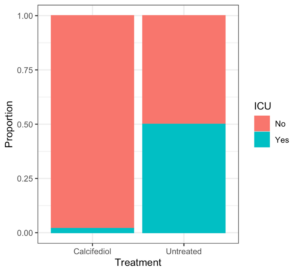
In a small, randomized clinical trialconducted in Spain, 76 patients hospitalized with COVID-19 were randomized to either receive a calcifediol (vitamin D) treatment or not. All the patients were treated with the standard intervention for COVID-19, which at the time was a combination of hydroxychloroquine and azithromycin. Researchers recorded whether each patient was admitted to the ICU or not.
Question 11
11) If the calcifedioltreatment had no effect on the severity of COVID-19 symptoms, how would you expect this graph to appear?Explain.
If the calcifediol treatment had no effect on the severity of COVID-19 symptoms, each patient would have either been admitted to the ICU or not regardless of the treatment to which they were assigned. In other words, the 13 patients admitted to the ICU who were in the group that did not receive calcifediol would have ended up being admitted to the ICU even if they had received calcifediol. While it is possible that calcifediol does not help lower the risk of admission to the ICU for COVID-19 patients and the researchers were unlucky and just happened to “draw” more of the subjects who were going to be admitted to the ICU into the untreated group, we would like to determine whether this outcome is probable. If 14 out of the 76 patients were going to be admitted to the ICU no matter what, we would have expected around the same proportion of those patients to end up in each group. The key question is how unlikely the observed difference in proportions of patients admitted to the ICU is by the random assignment process alone.We will answer this question by replicating the random assignment process all over again, under the assumption that calcifediol does not decrease the risk of ICU admission. We’ll start with 14 ICU admissions and 62 ICU non-admissions and then randomly assign 50 of these 76 subjects to the calcifediol-treated group and the other 26 to the calcifediol-untreated group.
Question 12
12) Go to the DCMP Association Between Two Categorical Variables tool at https://dcmathpathways.shinyapps.io/Association_Categorical/.•Under “Data Entry & Descriptive Statistics:”oSelect “Contingency Table” under “Enter Data.”oType “ICU” for the row variable, with “Admitted” and “Not admitted” for the category labels.oType “Group” for the columnvariable, with “Treated” and “Untreated” as the category labels.oEnter the contingency table completed in Question 7.•Now select “Permutation Distribution” in the top right.You should see the contingency table you entered as the “Observed Contingency Table.” Check “ICU” under “Permutate Labels of”andthen generate a single permutation of the data.
Part A:The shuffled counts in each group are shown under “Dataset from last permutation”on the right. Copy these resultsinto thefollowing2×2 table.
|
Treated with calcifediol |
Untreated with calcifediol |
Total |
| Admitted to ICU |
|
|
|
| Not admitted to ICU |
|
|
|
| Total |
|
|
|
Part B:Calculate theshuffled difference in proportionsof ICU admissions between the two groups (use calcifediol-treated –calcifediol-untreatedas the order of subtraction) in your simulated table from Part A.Hint: This should match the difference in proportions shown in the toolunder “Dataset from last permutation.”
Part C:Is the result of this simulated random assignment as “extreme” as the actual results that the researchers obtained? That is, did one or fewer of the ICU admissions end up in the calcifediol-treated group?
Part D:Combine your results with those from your classmates, producing a well-labeled dotplot. In what proportion of the simulated-random assignments were one or fewer of the ICU admissions assigned to the calcifediol-treated group?
Question 13
13) We can use the tool to simulate 1,000s of random assignments. Click “Reset,” select “1,000”for “Number of permutations of the original data,” and then click “Generate Permutation(s).”
Part A: Examine the histogram of shuffled differences in proportions. Where is this plot centered? Explain.
Part B: Based on the histogram of shuffled differences in proportions, does it seem like the actual experimental result (only oneICU admission in the calcifediol-treated group) would besurprising to arise solely from the random assignment process under the assumption that calcifediolhas no effect on the severity of COVID-19 symptoms? Explain.
Part C: Select “Show statistical summary of permutation distribution” under “Options.” The tool will display the number and percentageof shuffled differences in proportions that are equal to or less than the one observed in the actual data at the bottom of the page. What percentageof the simulated randomizations resulted in a difference in proportions less than or equal to the one observed in the actual data?
You have just conducted what is called a randomization test (also sometimes called a permutation test)of the hypotheses you stated in Question 6, and your answer toQuestion 13, Part Cis an approximate P-value for this test. A P-value is the probability of obtaining the actual results or something more extreme, under the assumption of the null hypothesis. This can be approximated by simulating many, many randomizations under the null hypothesis and calculating the proportion of randomizations that produce results like ours—or something more extreme.
Question 14
14) Consider your approximate P-value from Question 13, Part C.
Part A:Is this P-value small enough so that you would consider the actualoutcomesurprising(or more extreme) under the null model that calcifediolhas no effect on the severity of COVID-19 symptoms? Explain.
Part B:Would you say that the researchers obtained strong evidence that the risk of ICU admission decreases when treated with calcifediol? Explain your reasoning based on your simulation results, including a discussion of the purpose of the simulation process and what information it revealed to help you answer this research question.
Part C:Are you willing to draw a cause-and-effect conclusion about calcifediol-treatment and ICU admissionbased on these results? Justify your answer based on the design of the study.
Part D:Are you willing to generalize these conclusions to all COVID-19 patients? Justify your answer based on the design of the study.