| score | rank | cls_profs | cls_students | age |
| 4.7 | tenure track | single | 43 | 36 |
| 4.1 | tenure track | single | 125 | 36 |
| 3.9 | tenure track | single | 125 | 36 |
| 4.8 | tenure track | single | 123 | 36 |
| 4.6 | tenured | multiple | 20 | 59 |
| 4.3 | tenured | multiple | 40 | 59 |
| 2.8 | tenured | multiple | 44 | 59 |
| 4.1 | tenured | single | 55 | 51 |
| 3.4 | tenured | single | 195 | 51 |
| 4.5 | tenured | single | 46 | 40 |

| cls_did_eval | cls_perc_eval | age | cls_students | score |
| 24 | 55.81395 | 36 | 43 | 4.7 |
| 86 | 68.8 | 36 | 125 | 4.1 |
| 76 | 60.8 | 36 | 125 | 3.9 |
| 77 | 62.60163 | 36 | 123 | 4.8 |
| 17 | 85 | 59 | 20 | 4.6 |
| 35 | 87.5 | 59 | 40 | 4.3 |
| 39 | 88.63636 | 59 | 44 | 2.8 |
| 55 | 100 | 51 | 55 | 4.1 |
| 111 | 56.92308 | 51 | 195 | 3.4 |
| 40 | 86.95652 | 40 | 46 | 4.5 |
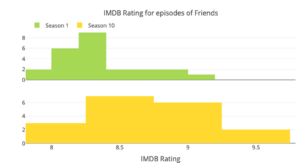
| season | episode | title | us_views_millions | imdb_rating |
| 1 | 1 | The Pilot | 21.5 | 8.3 |
| 1 | 2 | The One with the Sonogram at the End | 20.2 | 8.1 |
| 1 | 3 | The One with the Thumb | 19.5 | 8.2 |
| 1 | 4 | The One with George Stephanopoulos | 19.7 | 8.1 |
| 1 | 5 | The One with the East German Laundry Detergent | 18.6 | 8.5 |
| 1 | 6 | The One with the Butt | 18.2 | 8.1 |
| 1 | 7 | The One with the Blackout | 23.5 | 9 |
| 1 | 8 | The One Where Nana Dies Twice | 21.1 | 8.1 |
| 1 | 9 | The One Where Underdog Gets Away | 23.1 | 8.2 |
| 1 | 10 | The One with the Monkey | 19.9 | 8.1 |
| species | island | bill_length_mm | bill_depth_mm | flipper_length_mm | body_mass_g | sex | year |
| Adelie | Torgersen | 39.1 | 18.7 | 181 | 3,750 | male | 2007 |
| Adelie | Torgersen | 39.5 | 17.4 | 186 | 3,800 | female | 2007 |
| Adelie | Torgersen | 40.3 | 18 | 195 | 3,250 | female | 2007 |
| Adelie | Torgersen | N/A | N/A | N/A | N/A | N/A | 2007 |
| Adelie | Torgersen | 36.7 | 19.3 | 193 | 3,450 | female | 2007 |
| Adelie | Torgersen | 39.3 | 20.6 | 190 | 3,650 | male | 2007 |
| Adelie | Torgersen | 38.9 | 17.8 | 181 | 3,625 | female | 2007 |
| Adelie | Torgersen | 39.2 | 19.6 | 195 | 4,675 | male | 2007 |
| Adelie | Torgersen | 34.1 | 18.1 | 193 | 3,475 | N/A | 2007 |
| Adelie | Torgersen | 42 | 20.2 | 190 | 4,250 | N/A | 2007 |
| Skill or Concept: I can . . . | Questions to check your understanding | Rating from 1 to 5 |
| Use technology to make a histogram of a quantitative variable. | 1 | |
| Use a histogram to answer questions about the distribution of a quantitative variable. | 2 | |
| Describe the shape of a distribution. | 3 | |
| Describe the center and spread of a distribution. | 4, 5 | |
| Identify if there are outliers in a distribution. | 6 | |
| Match the description of a distribution to the graphical display. | 7 |
Glossary
- minimum
- the smallest observation or value.
- maximum
- the largest observation or value.
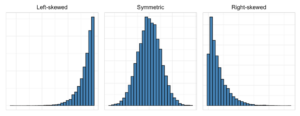
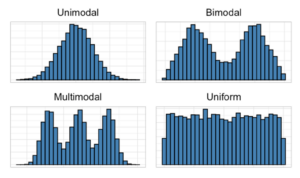
- shape
- the overall pattern (left skewed, right skewed, symmetric) and the number of peaks (unimodal, bimodal, multimodal, uniform).
- center
- a measure that describes where the middle of the distribution is. The center is a number that describes a typical value. For example, one way to think about center is that it could be the point in the distribution where about half of the observations are below it and half are above it.
- spread
- a measure of how far apart the data are. In this lesson, the range is used to measure spread. The range is the difference between the maximum value and minimum value.
- outlier
- unusual observations that are outside the general pattern of the distribution.
- skew/skewness
- a visual difference from symmetry in a dataset.
- modality
- the number of peaks in the description of the shape in a dataset.
- unimodal
- one prominent peak in the distribution.
- bimodal
- two prominent peaks in the distribution.
- multimodal
- three or more prominent peaks in the distribution.
- uniform
- no prominent peaks in the distribution.
- range
- the difference between the minimum and maximum values in the dataset.
- symmetric
- the left and right sides of the distribution (closely) mirror each other. If you drew a vertical line down the center of the distribution and folded the distribution in half, the left and right sides would closely match one another.
- left-skewed
- the visual distribution where the left side has a longer tail.
- right-skewed
- the visual distribution where the right side has a longer tail.
