
| Country | Population Rank | GDP per Capita |
| China | 1 | $9,771 |
| India | 2 | $2,016 |
| United States | 3 | $62,641 |
| Indonesia | 4 | $3,894 |
| Pakistan | 5 | $1,473 |
| Brazil | 6 | $8,921 |
| Nigeria | 7 | $2,028 |
| Bangladesh | 8 | $1,698 |
| Russia | 9 | $11,289 |
| Japan | 10 | $39,287 |
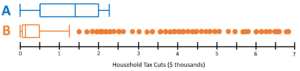
| Income Group | Mean Tax Cut |
| Lowest Quintile | $40 |
| Second Quintile | $320 |
| Middle Quintile | $780 |
| Fourth Quintile | $1,480 |
| Top Quintile | $5,790 |
| Top 1 Percent | $32,650 |
| Top 0.1 Percent | $89,060 |
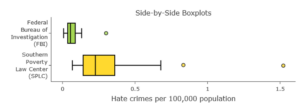
| state_abbrev | median_house_inc | hate_crimes_per_100k_splc | avg_hatecrimes_per_100k_fbi |
| AL | 42278 | 0.125838926 | 1.806410489 |
| AK | 67629 | 0.143740118 | 1.656700109 |
| AZ | 49254 | 0.225319954 | 3.413927994 |
| AR | 44922 | 0.069060773 | 0.869208872 |
| CA | 60487 | 0.255805361 | 2.397985899 |
| CO | 60940 | 0.390523301 | 2.804688765 |
| CT | 70161 | 0.335392269 | 3.772701469 |
| DE | 57522 | 0.322754169 | 1.469979563 |
| DC | 68277 | 1.52230172 | 10.95347971 |
| Minimum | First
Quartile |
Median | Third
Quartile |
Maximum |
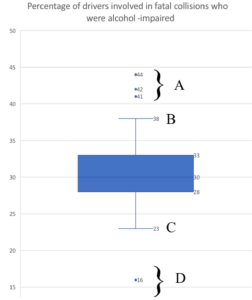
| 16 | 28 | 30 | 33 | 44 |
| Term | Boxplot Feature |
| Minimum | |
| First quartile (Q1) | |
| Median | |
| Third quartile (Q3) | |
| Maximum |
| Term | Boxplot Feature |
| Upper outlier(s) | |
| Lower outlier(s) | |
| Greatest value of an observation that is not an upper outlier | |
| Lowest value of an observation that is not a lower outlier |
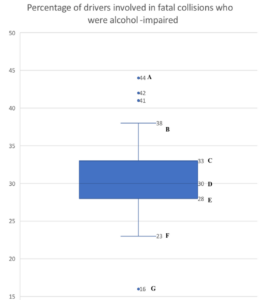
| State | Percentage of Drivers Involved in Fatal Crashes and Impaired by Alcohol | State | Percentage of Drivers Involved in Fatal Crashes and Impaired by Alcohol |
| Utah | 16 | Maine | 30 |
| Kentucky | 23 | New Hampshire | 30 |
| Kansas | 24 | Vermont | 30 |
| Alaska | 25 | Mississippi | 31 |
| Georgia | 25 | North Carolina | 31 |
| Iowa | 25 | Pennsylvania | 31 |
| Arkansas | 26 | Maryland | 32 |
| Oregon | 26 | Nevada | 32 |
| District of Columbia | 27 | Wyoming | 32 |
| New Mexico | 27 | Louisiana | 33 |
| Virginia | 27 | South Dakota | 33 |
| Arizona | 28 | Washington | 33 |
| California | 28 | Wisconsin | 33 |
| Colorado | 28 | Illinois | 34 |
| Michigan | 28 | Missouri | 34 |
| New Jersey | 28 | Ohio | 34 |
| West Virginia | 28 | Massachusetts | 35 |
| Florida | 29 | Nebraska | 35 |
| Idaho | 29 | Connecticut | 36 |
| Indiana | 29 | Rhode Island | 38 |
| Minnesota | 29 | Texas | 38 |
| New York | 29 | Hawaii | 41 |
| Oklahoma | 29 | South Carolina | 41 |
| Tennessee | 29 | North Dakota | 42 |
| Alabama | 30 | Montana | 44 |
| Delaware | 30 |
| Boxplot | Distribution |
 |
a) left skewed
b) symmetric c) right skewed |
 |
a) left skewed
b) symmetric c) right skewed |
 |
a) left skewed
b) symmetric c) right skewed |
| Skill or Concept: I can . . . | Questions to check your understanding | Rating from 1 to 5 |
| Identify the features of a boxplot. | 1, 4 | |
| Interpret the features of a boxplot. | 2 | |
| Identify outliers in a dataset. | 3, 5 | |
| Relate a boxplot of a quantitative variable to its distribution. | 6–8 |
Glossary
- first quartile
- the value below which one quarter of the data lies, also equal to the 25th percentile. Sometimes denoted Q1.
- third quartile
- the value below which three quarters of the data lay, also equal to the 75th percentile. Sometimes denoted as Q3.
- interquartile range
- the quantity Q3–Q1. Sometimes denoted IQR.
- five-number summary
- the collection of the minimum, first quartile, median, third quartile, and maximum of the variable.
- upper outlier
- an observation that is greater than Q3 + 1.5 × (IQR).
- lower outlier
- an observation that is less than Q1 – 1.5 × (IQR).
