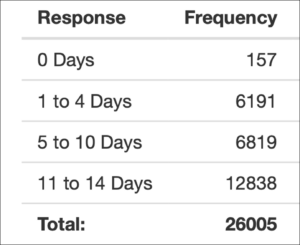

| Response | Frequency | Proportion / Relative Frequency |
| 0 Days | 157 | |
| 1 to 4 Days | 6,191 | |
| 5 to 10 Days | 6,819 | |
| 11 to 14 Days | 12,838 | |
| Total: | 26,005 | 1 |
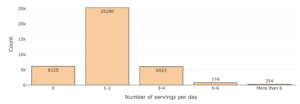
| Servings per day | Frequency | Proportion / Relative Frequency |
| 0 | ||
| 1 to 2 | ||
| 3 to 4 | ||
| 5 to 6 | ||
| More than 6 | ||
| Total: |
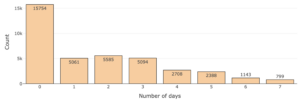
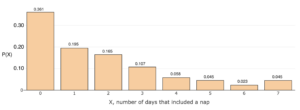
| , Number of days | |
| 0 | 0.336 |
| 1 | 0.231 |
| 2 | 0.143 |
| 3 | 0.085 |
| 4 | 0.051 |
| 5 | 0.053 |
| 6 | 0.028 |
| 7 | 0.074 |
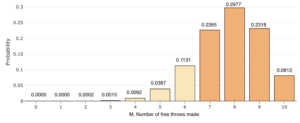
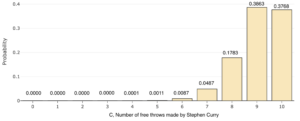
| , Number of free throws made | |
| 0 | 0.0000 |
| 1 | 0.0000 |
| 2 | 0.0002 |
| 3 | 0.0015 |
| 4 | 0.0092 |
| 5 | 0.0387 |
| 6 | 0.1131 |
| 7 | 0.2265 |
| 8 | 0.2977 |
| 9 | 0.2318 |
| 10 | 0.0812 |
| , Number of days that included a nap | Frequency |
| 0 | |
| 1 | |
| 2 | |
| 3 | |
| 4 | |
| 5 | |
| 6 | |
| 7 | |
| TOTAL: |
| , Number of days that included a nap | ,
The probability of randomly selecting an individual who stated days with a nap |
| 0 | |
| 1 | |
| 2 | |
| 3 | |
| 4 | |
| 5 | |
| 6 | |
| 7 | |
| SUM: |
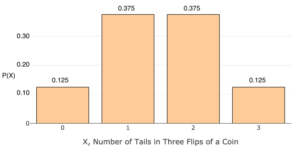
| Experimental Outcome | , Number of Tails in 3 Flips of a Coin |
| HHH | 0 |
| HHT | |
| HTH | |
| THH | |
| TTH | |
| THT | |
| HTT | |
| TTT | 3 |
| , Number of Tails in 3 Flips of a Coin | Frequency | Relative Frequency |
| 0 | ||
| 1 | ||
| 2 | ||
| 3 | 1 | 0.125 |
| Total: | 8 | 1 |
| , Number of days | |
| 0 | 0.336 |
| 1 | 0.231 |
| 2 | 0.143 |
| 3 | 0.085 |
| 4 | 0.520 |
| 5 | 0.053 |
| 6 | 0.028 |
| 7 | 0.074 |
| , Number of days | |
| 0 | 0.4974 |
| 1 | 0.1811 |
| 2 | 0.1391 |
| 3 | 0.0729 |
| 4 | 0.0377 |
| 5 | 0.0325 |
| 6 | 0.012 |
| 7 | 0.0271 |
| Skill or Concept: I can . . . | Questions to check your understanding | Rating from 1 to 5 |
| Make connections between frequency, relative frequency, and probability. | 1 | |
| Interpret discrete probability distributions to calculate probabilities, including those involving the phrases OR, at least, at most, less than, and greater than. | 2 | |
| Identify whether a table or graph represents a probability distribution for a discrete random variable. | 3 |
Glossary
- discrete random variable
- a variable that takes a fixed set of possible numerical values and it is not possible to get any value in between.
