Preparing for the next class
In the next in-class activity, you will need to make connections between frequency, relative frequency, and probability. You will also need to interpret discrete probability distributions to calculate probabilities, including those involving the phrases OR, at least, at most, less than, and greater than. Finally, you will need to identify whether a table or graph represents a probability distribution for a discrete random variable.
Question 1
Consider the chance experiment of flipping a fair coin 3 times. The 8 possible outcomes of this experiment are provided below (with “H” representing heads and “T” representing tails):
HHH HHT HTH THH TTH THT HTT TTT
- Suppose we are interested in describing the number of tails that are flipped. Using the random variable [latex]X[/latex] to represent the number of tails that we find in each outcome, complete the following table.
Experimental Outcome [latex]X[/latex], Number of Tails in 3 Flips of a Coin HHH 0 HHT HTH THH TTH THT HTT TTT 3 Hint: The variable [latex]X[/latex] represents the number of tails we find in 3 coin flips. The outcome HHH has 0 tails, and TTT has 3 tails. Count the number of tails in each of the remaining outcomes of the experiment to complete the table.
- In the second column of the previous table, we can see that our random variable, [latex]X[/latex], could be one of four values depending on the number of tails that are flipped (0, 1, 2, or 3).Out of the 8 possible experimental outcomes, how many times do we find 0 tails? What about for the other values of the random variable (1, 2, and 3)? Complete the following table with the frequency and relative frequency values.Remember, relative frequency can be calculated by taking the frequency of the individual value and dividing it by the total frequency.
[latex]X[/latex], Number of Tails in 3 Flips of a Coin Frequency Relative Frequency
0 1 2 3 1 0.125 Total: 8 1 Hint: Go through each of the 8 possible outcomes provided in the table in Part A and count the number of the tails that are flipped. How many of the 8 outcomes have no tails? This is the frequency associated with 0 tails. How many of the 8 outcomes have exactly 1 tails? This is the frequency for 1. Repeat this for 2 tails and 3 tails, and then enter these values in the table.
In the first column of our table, we see the set of possible values of our random variable, [latex]X[/latex]. This variable [latex]X[/latex] is classified as a discrete random variable because it takes a fixed set of possible numerical values and it is not possible to get any value in between.
The probability distribution of a discrete random variable [latex]X[/latex] describes all possible values of the random variable, as well as the probability associated with each value. A discrete probability distribution is often presented in a table or graph.
Question 2
Discrete probability distributions can be represented with a table or bar graph. The following graph represents the probability distribution for the discrete variable number of tails in 3 flips of a coin. The graph includes the possible outcomes of the discrete variable and the probability associated with each outcome. We can see the probabilities are identical to the relative frequency values we calculated in the previous table.
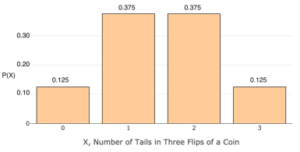
We can use this graph to calculate probabilities associated with values of the random variable.
- According to the probability distribution table, the probability associated with the value “2” is 0.375. This can also be written as [latex]P(X = 2)[/latex] = 0.375 or [latex]P[/latex](2 tails) = 0.375. Which of the following is the correct interpretation of this mathematical statement?
- The probability of getting 3 tails in 3 coin flips is 0.375.
- The probability of getting 2 tails in 3 coin flips is 0.375.
- The probability of getting this result in 2 coin flips is 0.375.
- The probability of getting 0, 1, 2, or 3 tails in 3 flips is 0.375. Hint: The number inside the parentheses describes the value of the random variable, described in the first column of our probability distribution table.
- According to the probability distribution table, what is the probability of flipping all tails? In other words, what is [latex]P(X = 3)[/latex] or [latex]P[/latex](3 tails)?
Hint: The number inside the parentheses describes the value of the random variable, described in the first column of our probability distribution table. - The values of the random variable, [latex]X[/latex], are mutually exclusive. This means we can use what we learned in In-Class Activity 7.B to calculate probabilities involving the word “OR:”
[latex]P(A OR B) = P(A) + P(B)[/latex]
The probability of finding at least 2 tails in 3 coin flips, written[latex]P[/latex](2 tails OR 3 tails), can be calculated by [latex]P[/latex](2 tails) + [latex]P[/latex](3 tails).Calculate this value.Hint: Identify the probability of getting 2 tails,[latex]P[/latex](2 tails), and the probability of getting 3 tails, [latex]P[/latex](3 tails). [latex]P[/latex](2 tails OR 3 tails) =[latex]P[/latex](2 tails) + [latex]P[/latex](3 tails) - According to the probability distribution table, what is the probability of flipping less than 2 tails? That is, what is [latex]P(X < 2)[/latex]? Hint: Flipping less than 2 tails means we would flip either 0 or 1 tails. What is [latex]P[/latex](0 tails OR 1 tails)?
There are a few important properties of discrete probability distributions that we should consider:
- The values associated with the random variable of interest are numerical and discrete.
- All possible values of the random variable are listed in a table or graph, with each value having an associated probability greater than or equal to 0 and less than or equal to 1.
- The sum of all probabilities in the table or graph equals 1.
Question 3
Given these important properties, address the following questions.
- A recent survey[1] conducted by the American College Health Association explored health-related behaviors of college students. One of the questions posed to the participants was, “Within the last 12 months, how often did you wear a helmet when you rode a bicycle?”The following table displays the responses to this question, as well as the probability of a surveyed college student responding with that choice.This graph is not a discrete probability distribution.Which of the following explains why this is not a discrete probability distribution?
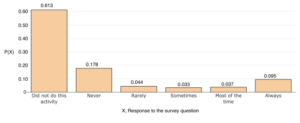
- The variable of interest, “[latex]X[/latex], Response to the survey question,” is not numerical and discrete.
- Not all of the probabilities in the graph are appropriate. At least one of the probabilities provided in the graph is less than 0 or greater than 1.
- The sum of all the probabilities in the graph does not equal 1.
Hint: Revisit the properties stated previously. Which property is not met?
- Another question posed to the college students in the survey was, “Out of the last 7 days, how many days did you have an extremely hard time falling asleep?”The following table displays the potential responses to this question, as well as the probability of a surveyed college student responding with that value.This table is not a discrete probability distribution. Which of the following explains why this is not a discrete probability distribution?
[latex]N[/latex], Number of days [latex]P(N)[/latex] 0 0.336 1 0.231 2 0.143 3 0.085 4 0.520 5 0.053 6 0.028 7 0.074 - The variable of interest, “[latex]N[/latex], Number of days,” is not numerical and discrete.
- Not all of the probabilities provided in the table are appropriate. At least one of the probabilities provided in the table is less than 0 or greater than 1.
- The sum of all the probabilities in the table does not equal 1.
Hint: Revisit the properties stated previously. Which property is not met?
- Another question posed to the college students in the survey was, “Out of the last 7 days, how many days did you wake up too early in the morning and couldn’t get back to sleep?”The following table displays the potential responses to this question, as well as the probability of a surveyed college student responding with that value.True or false: This table represents a discrete probability distribution.
[latex]D[/latex], Number of days [latex]P(D)[/latex] 0 0.4974 1 0.1811 2 0.1391 3 0.0729 4 0.0377 5 0.0325 6 0.012 7 0.0271 Hint: Revisit the properties stated previously. Does the table exhibit all of the properties?
Looking ahead
During the upcoming in-class activity, you will be using class data to construct a discrete probability distribution. Please answer the question below. Your instructor may also be contacting you to gather these data via a short survey.
Question 4
On how many of the last 7 days did you take a nap?
- 0 days
- 1 day
- 2 days
- 3 days
- 4 days
- 5 days
- 6 days
- 7 days
- American College Health Association-National College Health Assessment. (2020). Undergraduate student reference group data report, Fall 2019. https://www.acha.org/NCHA/ACHA NCHA_Data/Publications_and_Reports/NCHA/Data/Reports_ACHA-NCHAIII.aspx ↵
