Skip to main content
Exemplar Statistics Alpha Book
Spencer Image/Table Part
Search for:
8D
Glossary
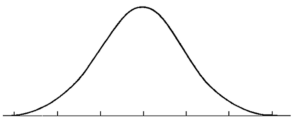
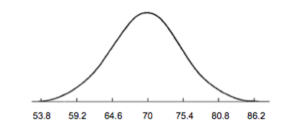
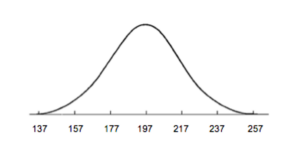
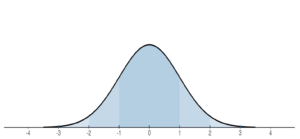
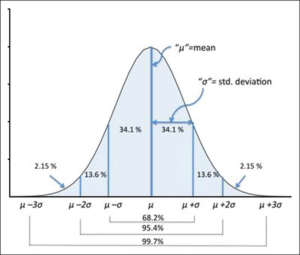
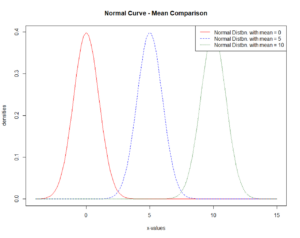
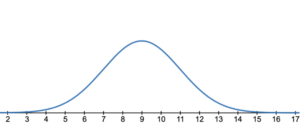
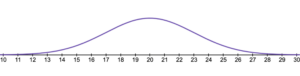
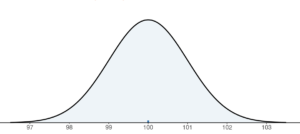
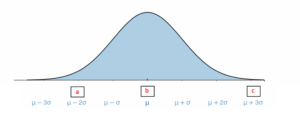
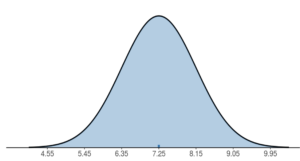
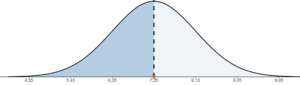
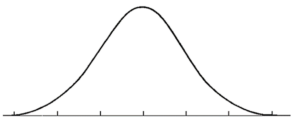
normal distribution
a distribution where 𝑥 is a continuous random variable, the distribution is symmetrical, and there is a single peak around the mean.
Previous
Next