In the next preview assignment and in the next class, you will need to label the means and standard deviations of graphs of bell-shaped curves. This will require you to calculate [latex]±1[/latex], [latex]±2[/latex], and [latex]±3[/latex] standard deviations from the mean and know how to place those values on a number line.
Labeling Histograms: Big Mac Index
In 1986, The Economist invented the Big Mac index,[1] an informal guide to understanding whether global currencies are overvalued or undervalued. The index is based on the idea that identical goods, such as the Big Mac, should cost the same amount in any two countries. Note that the Big Mac index was never meant to be completely accurate but was created as a tool to more easily understand currency exchange rates
Question 1
The following table lists Big Mac prices in different countries in 2021.[2] Why do you think a Big Mac costs more in some countries?
| Country | Cost of Big Mac |
| Argentina | $3.75 |
| Australia | $4.98 |
| South Korea | $4.10 |
| Egypt | $2.72 |
| Mexico | $2.68 |
| United States | $5.66 |
Question 2
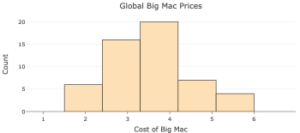
In 2021, the average cost of a Big Mac across the world in U.S. dollars was $3.52 with a standard deviation of $0.96.3 The following is a histogram of Big Mac prices across the world.
Note: Three outliers were removed from the dataset.
On the x-axis, label the approximate location of the mean.
Question 3
When doing statistical analysis, we are often interested in seeing what values fall within one standard deviation of the mean. In this case, we can represent the interval within one standard deviation of the mean as $3.52 [latex]±[/latex] $0.96.
- Which number is exactly one standard deviation below the mean?
- Which number is exactly one standard deviation above the mean?
- Label the x-axis of the histogram in Question 2 using your answers from Parts a and b.
Question 4
In addition to one standard deviation, we are also interested in seeing what values fall within [latex]±2[/latex] standard deviations of the mean and within [latex]±3[/latex] standard deviations of the mean.
- Calculate the mean [latex]±2[/latex] standard deviations.
- Calculate the mean [latex]±3[/latex] standard deviations.
- Label the x-axis of the histogram in Question 2 using your answers from Parts a and b.
Question 5
The following table shows the cost of a Big Mac in five countries. For each country in the table, state whether the cost of a Big Mac is to the right or left of the mean and if the cost is higher or lower than average.
| Country | Cost of Big Mac | Right or Left of the Mean | Cost Higher or
Lower Than Average |
| Argentina | $3.75 | right | higher |
| Australia | $4.98 | ||
| South Korea | $4.10 | ||
| Egypt | $2.72 | ||
| Mexico | $2.68 |
Question 6
The following histogram shows the distribution of Big Mac prices. Use the table in Question 5 to answer the following questions.
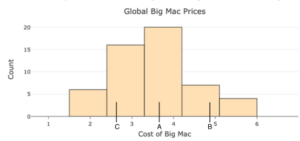
- Which letter represents the value of the cost of a Big Mac in Argentina?
- Which letter represents the value of the cost of a Big Mac in Mexico?
- Which letter represents the value of the cost of a Big Mac in Australia?
