The amount of cholesterol in a person’s blood plays an important role in the health of their heart and blood vessels. Most adults have their cholesterol levels checked at least every five years. To help guide treatment, medical organizations have established guidelines that define which cholesterol levels are considered healthy.[1]

Credit: iStock/udra
Question 1
What statistical tools and methods do you think would be useful for medical organizations when defining the guidelines for healthy levels of cholesterol?
Question 2
Cholesterol levels for adults in the United States are normally distributed, so the normal distribution is a useful tool in evaluating cholesterol levels. According to the Centers for Disease Control and Prevention (CDC), the mean cholesterol level for adults is 191 milligrams of cholesterol per deciliter of blood (mg/dL), with a standard deviation (SD) of 40.7.[2]
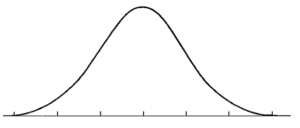
- Using the DCMP Normal Distribution tool at https://dcmathpathways.shinyapps.io/NormalDist/%20, create a graph that shades the area under the curve from one SD below the mean to one SD above the mean. Sketch your results on the curve below. Be sure to include the labels for the mean [latex]\pm 3[/latex] SDs.
- If we tested the cholesterol of a random adult, what is the probability it would be within one SD of the mean?
- A cholesterol level below 200 mg/dL is ideal.[3] Estimate the probability that a randomly selected adult will have a cholesterol level below 200.
- A cholesterol level between 200 and 239 mg/dL is borderline high.[4] Estimate the probability that a randomly selected adult will have a cholesterol level between 200 and 239.
- he CDC reports that 11.5% of adults in the United States have high cholesterol (over 240 mg/dL).[5] How does this compare to your own analysis of the data?
Question 3
Blood pressure is another important indicator of heart health. Like cholesterol, blood pressure levels for adults in the United States are normally distributed. However, an individual’s blood pressure also varies in a normally distributed pattern throughout the day based on factors such as position, activity level, and anxiety. Blood pressure is reported as the systolic pressure (heart is pumping) over the diastolic pressure (heart is relaxing).
Systolic blood pressure values below 120 millimeters of mercury (mm Hg) are considered healthy, while values over 140 mm Hg are classified as high. Values between 120 and 140 mm Hg are borderline.[6] The values of the SD also vary depending on the assumed mean value of the systolic blood pressure. The SD for individual blood pressure is 9.9% of the mean systolic blood pressure.
- For a patient with a mean systolic pressure of 120 mm Hg, the SD of individual blood pressure measurements is about 11.9.[7] If a healthcare provider checks this patient’s blood pressure, what is the probability the measurement will be greater than 140?
- For a patient with a mean systolic pressure of 130 mm Hg, the SD of individual blood pressure measurements is about 12.9. If a healthcare provider checks this patient’s blood pressure, what is the probability the measurement will be greater than 140?
- A healthcare provider is seeing a new patient for the first time. The patient’s measured systolic blood pressure is 140 mm Hg. Should the provider diagnose the patient with high blood pressure? Explain.
- A different patient has a single systolic blood pressure reading of 170 mm Hg. Discuss the likelihood that this patient’s actual mean blood pressure is greater than 140 mm Hg. Note that if the assumed mean is 140 mm Hg, the SD is 13.9.
Question 4
Children’s blood pressures vary with age and size, so guidelines have to account for that variation. Instead of providing simple numeric ranges (like we see with adults), the guidelines are based on where a child’s blood pressure falls in the normal distribution of all measurements for children of the same age and height.[8]
- Hypertension for children is defined as an average systolic blood pressure over the 95th percentile for age and height. For 8-year-old boys who are 50 inches tall, the distribution of systolic blood pressures has a mean of 97 and a SD of 9.4.
What value of systolic blood pressure corresponds to the 95th percentile? (Use the tool for the calculation and include the proper units.) - Very low blood pressure is also dangerous and requires emergency medical treatment. Guidelines instruct healthcare providers to begin emergency treatment when a child’s systolic blood pressure drops below the 5th percentile.[9]
What value corresponds to the 5th percentile for an 8-year-old-boy who is 50 inches tall? (Use the tool for the calculation and include the proper units.)
- National Heart, Lung, and Blood Institute. (2021, January 4). Blood cholesterol. https://www.nhlbi.nih.gov/health-topics/blood-cholesterol ↵
- Centers for Disease Control and Prevention. (2021, March 1). Cholesterol. https://www.cdc.gov/nchs/fastats/cholesterol.htm ↵
- National Heart, Lung, and Blood Institute. (2001, May). ATP III guidelines at-a-glance quick desk reference. https://www.nhlbi.nih.gov/files/docs/guidelines/atglance.pdf ↵
- National Heart, Lung, and Blood Institute. (2001, May). ATP III guidelines at-a-glance quick desk reference. https://www.nhlbi.nih.gov/files/docs/guidelines/atglance.pdf ↵
- Centers for Disease Control and Prevention. (2021, March 1). Cholesterol. https://www.cdc.gov/nchs/fastats/cholesterol.htm ↵
- National Heart, Lung, and Blood Institute. (2020, May 8). High blood pressure. https://www.nhlbi.nih.gov/health-topics/high-blood-pressure ↵
- Marshall, T. P. (2008, January 1). Blood pressure variability: The challenge of variation. American Journal of Hypertension, 21(1), 3-4. https://academic.oup.com/ajh/article/21/1/3/137216 ↵
- Flynn, J. T., Kaelber, D. C., Baker-Smith, C. M., Blowey, D., Carroll, A. E., Daniels, S. R., de Ferranti, S. D., Dionne, J. M., Falkner, B., Flinn, S. K., Gidding, S. S., Goodwin, C., Leu, M. G., Powers, M. E., Rea, C., Samuels, J., Simasek, M., Thaker, V. V., & Urbina, E. M. (2017, September). Clinical practice guideline for screening and management of high blood pressure in children and adolescents. Pediatrics, 140(3), e20171904. https://doi.org/10.1542/peds.2017-1904 ↵
- U.S. Department of Health & Human Services, Chemical Hazards Emergency Medical Management. (2021, March 8). Pediatric basic and advanced life support. https://chemm.nlm.nih.gov/pals.htm ↵
