In the next preview assignment and in the next class, you will need to be able to evaluate formulas used to find the mean and standard deviation of a binomial experiment, create continuous intervals using the [latex]\pm[/latex] symbol, and translate intervals in context to probability notation.
Commute Time
Each year, the United States Census Bureau puts out a survey called The American Community Survey.[1] This survey provides information about the social and economic needs of your community. Responses to this survey help provide local and national leaders with the information they need for planning and programs.
Question 1
One of the questions in the survey asks about the time (in minutes) it takes to commute to work. Is this value discrete or continuous?
Question 2
Suppose the commuting times reported were between 0 and 150 minutes. Think about the time it takes for a person to commute to work as a random variable.
- What values can the variable have?
- Can you list all of the values of the variable (all possible commute times)? Explain.
- What are the units of the random variable (commute time)?
Question 3
In the upcoming in-class activity, you will be dealing with translating intervals in context to notation. This is necessary for calculating purposes. Also, you need to be comfortable with identifying values that would be located within an interval.
Complete the following table where the information in the first column represents the inequality using inequality notation, the second column expresses the inequality in words, and the third column lists examples of values that can be found within the interval. In the second column, use language such as between, at most, no more than, up to, at least, etc. that is commonly used in probability to describe inequalities.
| Notation | Translation | Example of Values Within the Interval |
| [latex]X < 25[/latex] | [latex]X[/latex] is fewer than 25 | 22, 27.8, 15.5 |
| [latex]X \geq 45[/latex] | ||
| [latex]X[/latex] is between 60 and 75, not inclusive | ||
| [latex]X > 120[/latex] |
Question 4
In the next in-class activity, you will also need to be able to translate intervals in context to notation. Although you may have practiced this concept before, the more problems you practice, the more comfortable you will become with the various ways to describe inequalities.
Complete the missing phrase, inequalities, and interpretation in the following table. Use [latex]X[/latex] to represent the random variable.
| Phrase | Inequality | Example of Values Within the Interval |
| A heart rate of at least 80
beats per minute (bpm) |
If a heart rate is at least 80 bpm, it means that it can be 80, 81, 82, …bpm. | |
| A commute
time of less than 48 minutes |
[latex]0 < X < 48[/latex] | |
| [latex]X \leq 70[/latex] | If the speed is no more than 70 miles per hour (mph), it means that it can be anywhere from 0 mph up to and including 70 mph. | |
| A temperature above 100.2 is considered a fever for
COVID-19. |
If a temperature above 100.2 is considered a fever for COVID-19, it means that it can be any value greater than 100.2. This value does not include 100.2. |
Question 5
Use probability notation to represent the following statements. Use [latex]X[/latex] to represent the random variable.
- The probability that the commute time will be less than 30 minutes
- The probability that the temperature will be above 100.2° F
- A heart rate of at least 80 bpm
Question 6
You will need to be able to check criteria to determine whether or not a normal distribution can be used to approximate probabilities of a binomial distribution using the following inequalities: [latex]np > 10 \mbox{ and } n(1 – p) > 10[/latex].
- Suppose you know that [latex]n = 10 \mbox{ and } p = 0.90[/latex]. Is [latex]np > 10 \mbox{ AND } n(1 – p)[/latex]?
- If [latex]n = 490 \mbox{ and } p = 0.64[/latex], are both [latex]np > 10 \mbox{ and } n(1 – p) > 10[/latex]?
Question 7
In probability theory, a continuity correction is an adjustment that is made when a discrete distribution is approximated by a continuous distribution. We do this by adjusting the discrete whole numbers in a binomial distribution so that any individual value, X, is represented in the normal distribution by the interval form:
[latex]X - 0.5 \mbox{ to } X + 0.5[/latex]
- If [latex]X = 158[/latex] , find [latex]X \pm 0.5[/latex].
- Describe the interval from Part a using interval notation.
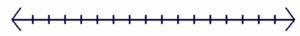
- Shade the area that represents the interval you created in Part B using the following number line.
Question 8
In In-Class Activity 8.C, you were introduced to finding the mean of a binomial distribution. The following formulas can be used to find the mean ([latex]\mu[/latex]) and standard deviation ([latex]\sigma[/latex]) of a binomial random variable:
[latex]\mu = np \mbox{ and } \sigma = \sqrt{np(1-p)}[/latex]
Suppose [latex]n = 178 \mbox{ and } p = 0.17[/latex].
- Find [latex]\mu[/latex]. Round your answer to the nearest whole number.
- Find [latex]\sigma[/latex]. Round your answer to the nearest whole number.
- United States Census Bureau. (2021, July 9). American Community Survey Data. https://www.census.gov/programs-surveys/acs/data.html ↵
