What you’ll need to know
In this support activity you’ll become familiar with the following:
You will also have an opportunity to refresh the following skills:
In the next section of the course material and in the following activity, you will need to understand and calculate the deviation from the mean. You will be extending this knowledge to understanding what the spread of a dataset is and how it is calculated.
Deviation from the Mean
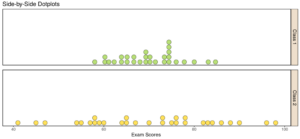
Consider the following dotplot of the exam scores for two different math classes on their midterm. The class average was 70 points for both Class 1 and Class 2.
question 1
The mean for both classes was 70 points. Does this tell the whole story? How are the two classes different?
In the next activity, we will be measuring the variability of a dataset. We do this by measuring the distance, known as deviation, from the mean. Let’s look at a more important example.
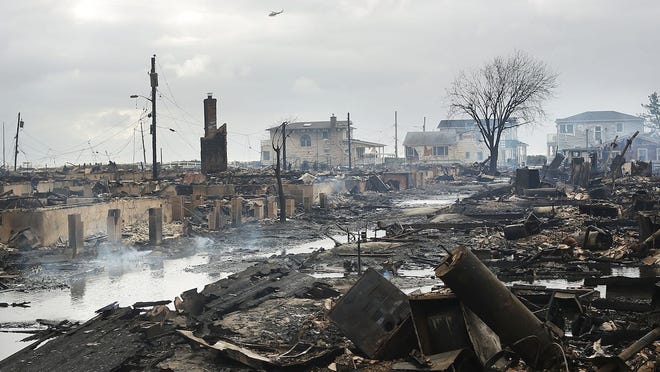
Hurricanes cause extensive amounts of damage. We are going to explore the amount of damage in dollars of the 30 most expensive hurricanes that have hit the U.S. mainland between 1990 and 2010 in this corequisite support activity. In order to explore this dataset, you will need to recall what you have learned about measures of center. We’ll concentrate on the mean of a quantitative distribution in this activity.
Before we move on, take a moment to recall the difference between mean and median.
recall
Do you recall the two measures of center you learned about in the previous section of the course: mean and median?
Core skill:
Let’s go to the technology to analyze the dataset “Hurricane Damage.”
Use technology to calculate the sample size and mean of a distribution
Go to the Describing and Exploring Quantitative Variables tool at https://dcmathpathways.shinyapps.io/EDA_quantitative/.
Step 1) Select the Single Group tab.
Step 2) Locate the drop-down menu under Enter Data and select From Textbook.
Step 3) Locate the drop-down menu under Dataset and select Hurricane Damage.
In the descriptive statistics at the top of the applet, you will see the sample size [latex]\left(n\right)[/latex] and the mean [latex]\left(\bar{x}\right)[/latex] of the dataset.
question 2
What is the sample size of the dataset?
question 3
What is the mean of the dataset in the context of the given situation?
Calculate the deviation from the mean of an observation in a dataset
A deviation from the mean is the distance between an observation [latex]\left(x\right)[/latex] in a dataset and the mean of the dataset. To calculate the deviation from the mean, subtract the sample mean [latex]\left(\bar{x}\right)[/latex] from each observation in the dataset [latex]\left(x-\bar{x}\right)[/latex].
Practice calculating the deviation from the mean in the following interactive example. Then, for the data table that follows, calculate the deviation from the mean to answer Question 4.
Interactive Example
Seven of 50 observations a student made about her commute time by bicycle from her apartment to school are listed in the following table. Her mean commute time was 10 minutes, [latex]\left(\bar{x}\right)=10[/latex]. Use this information to calculate the deviation from the mean [latex]\left(x-\bar{x}\right)[/latex] for each of the seven observations given.
|
Bike Ride to School (in minutes) [latex]({x})[/latex] |
Deviation from the Mean (in minutes) [latex]\left(x-\bar{x}\right)[/latex] |
| 8 | |
| 10 | |
| 12 | |
| 14 | |
| 5 | |
| 15 | |
| 9 |
Now it’s your turn to calculate the deviation from the mean.
question 4
Ten of the 30 observations are listed in the following table. Calculate the deviation from the mean [latex]\left(x-\bar{x}\right)[/latex] for each of the 10 observations given.
|
Hurricane Damage (in millions of dollars) [latex]({x})[/latex] |
Deviation from the Mean (in millions of dollars) [latex]\left(x-\bar{x}\right)[/latex] |
| 105,840 | |
| 45,561 | |
| 27,790 | |
| 20,587 | |
| 19,832 | |
| 15,820 | |
| 12,775 | |
| 11,797 | |
| 11,760 | |
| 11,227 |
Before answering Question 5, take a moment to consider the ways in which large numbers can be represented. In the table above, we see hurricane damage in millions of dollars in the column on the left. Look at the the bottom number in the column: 11,227. Presumably, that means 11,227 millions of dollars. But what does that mean in terms of a pure number? The hurricanes contributing to this data were catastrophic, causing billions of dollars of damage. Use the recall box below to see how to write a number like 11,227 million dollars as $11.227 billion. You may also see the Student Resource: Number-Word Combinations.
recall
It can be helpful to communicate large numbers using a combination of numbers and words.
When reading text containing a large value, we generally comprehend a number written as a combination of numbers and words more quickly than we do the pure number form. For example, it may take a moment to make sense of $1,250,000 but we understand immediately what $1.25 million represents.
Take a moment to refresh your understanding of combining numbers and words to express large numbers.
Core Skill:
Now, try Question 5.
question 5
In the second row of the table, what does 105,840 represent?
Before answering Question 6 and 7, you may wish to refresh your understanding of distance as an absolute value.
recall
When discussing the difference between two numbers as a distance, use the concept of absolute value to help make sense of the result. For example, we would say the difference between -1 and 3 is four units even though taking their difference may result in a negative or a positive depending upon which we subtract from which.
[latex]-1-3=-4\qquad\text{ and }\qquad3 - \left(-1\right)=4[/latex]
[latex]|-1-3|=4\qquad\text{ and }\qquad|3 - \left(-1\right)|=4[/latex]
See the skill below if needed for an example of how absolute value can be applied in Questions 6 and 7 and how to interpret positive and negative results when calculating deviation from the mean.
Core skill:
question 6
Look at the deviations from the mean you calculated in the previous table. Why are some of the values positive and some of the values negative?
question 7
Compare the deviation for the value 12,775 million dollars to the deviation for the value 27,790 million dollars. Which one is closer to the mean?
You’ve learned how to calculate the deviation from the mean in this activity, which you’ll be using in the upcoming section and following activity. You’ve also refreshed several mathematical skills and statistical definitions. Hopefully, you are feeling comfortable enough with these concepts to move on to the next section.
Candela Citations
- Damage shown from 2018 extreme weather season. Authored by: Spencer Platt / Getty Images. Provided by: USA Today. Located at: https://www.usatoday.com/story/money/2018/09/12/most-destructive-hurricanes-of-all-time/36697269/. License: All Rights Reserved
