what you’ll need to know:
In this support activity you’ll become familiar with the following:
- Use technology to create a scatterplot.
- Use a scatterplot to answer questions about a dataset.
- Describe a trend in a scatterplot.
In this section of the course and in the upcoming activity, you will use technology to create a scatterplot and use scatterplots to describe the relationship between two quantitative variables.
Scatterplots
Scatterplots are graphs that plot two quantitative variable values, an X-value on the horizontal axis, and a Y-value on the vertical axis, for each observational unit in a dataset. They show the relationship in the data between two sets of values, and are useful to visually determine whether a trend appears to exist in the data.
example
Suppose a small convenience store wondered what the relationship was between the number of bags of ice it sold and the temperature outside The scatterplot below displays the data collected. Use it to answer the following questions.
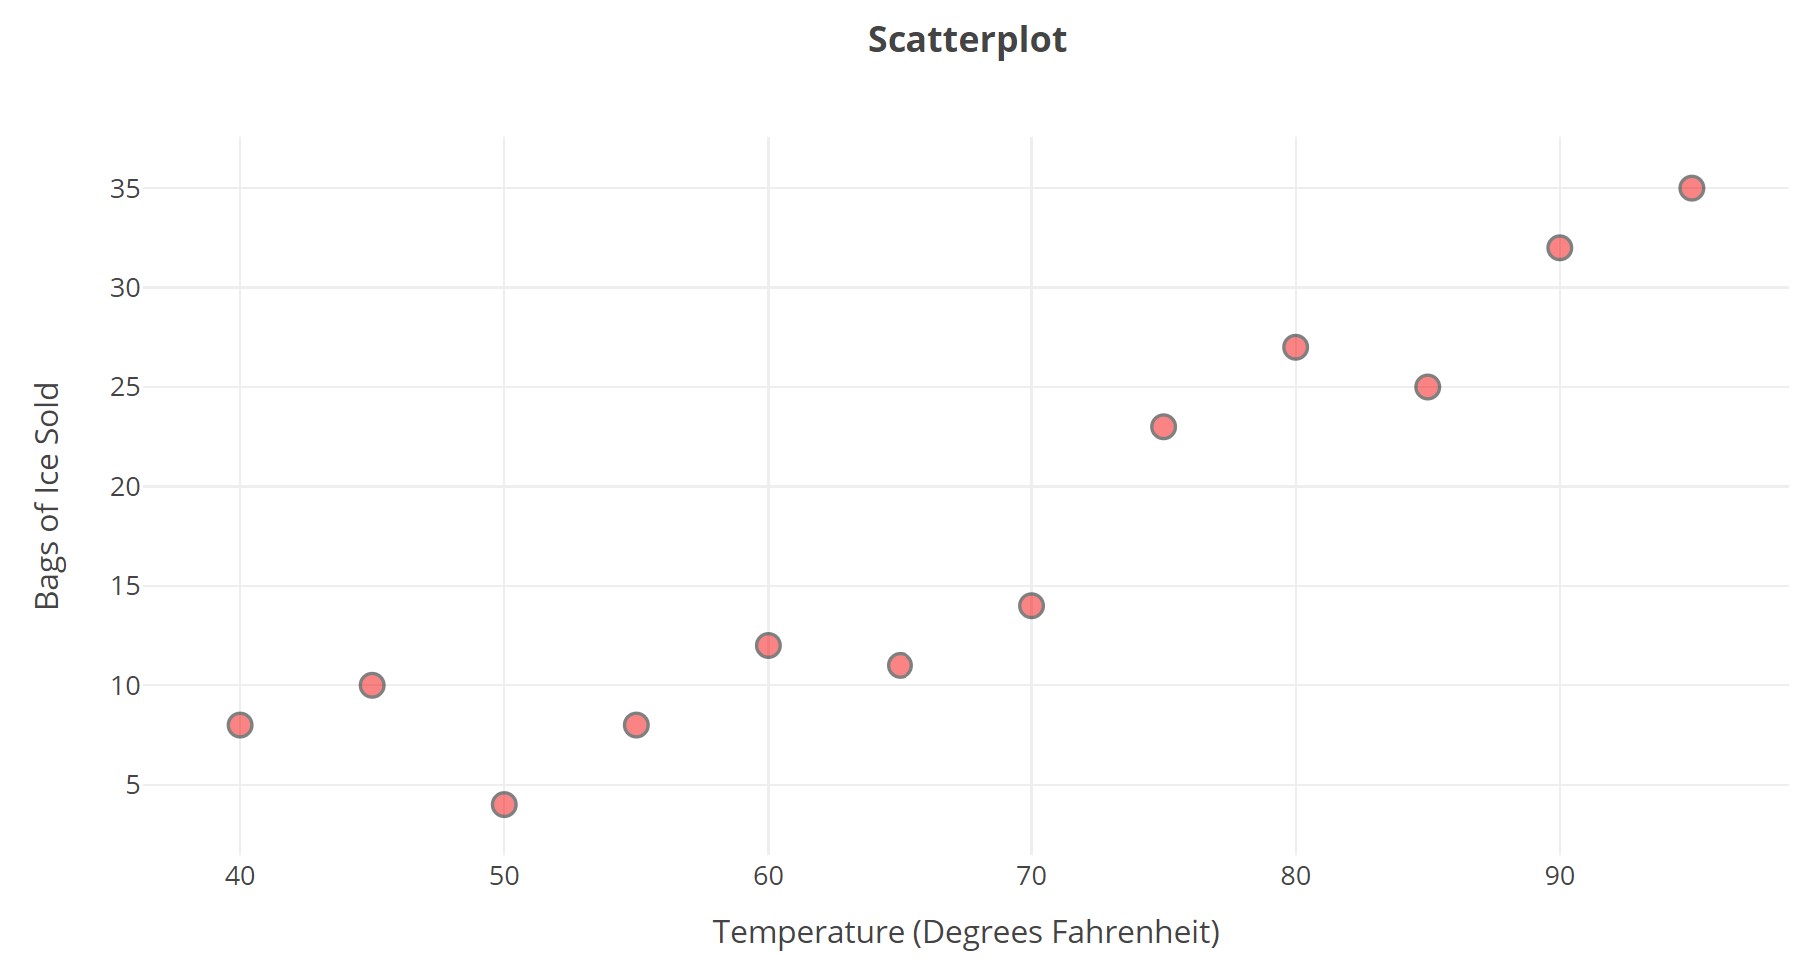
- What variable is graphed on the horizontal axis?
- What variable is graphed on the vertical axis?
- What do you think each dot on the graph represents?
- Does the number of bags sold seem to be increasing or decreasing as temperature increases?
In this corequisite support activity, we explore the relationship between neighborhood income and access to organic produce items at local grocery stores.
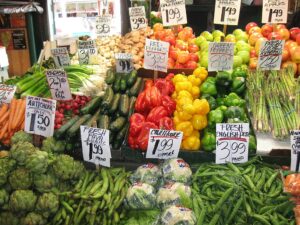
The table of data presented below includes information collected from 18 grocery stores in San Antonio, Texas. The average household income (in thousands of dollars)[1] and the number of organic vegetables offered were collected to explore this relationship.[2] We’ll enter the data into a data analysis tool to create a scatterplot then we’ll use the scatterplot to answer questions about the data.
| Store Location | Average Household Income ($1000s) | Number of Organic Vegetables Offered | Store Location | Average Household Income
($1000s) |
Number of Organic Vegetables Offered | |
| S. Flores | 71 | 36 | Marbach Rd. | 49 | 38 | |
| N. Rosillo St. | 34 | 4 | Babcock Rd. | 66 | 84 | |
| Nogalitos St. | 71 | 28 | Wurzbach Rd. | 87 | 61 | |
| Fredericksburg Rd. | 49 | 31 | W. Loop 1604 N. | 78 | 56 | |
| Olmos | 78 | 78 | Bandera Rd. | 59 | 62 | |
| N. New Braunfels Ave. | 41 | 14 | S. New Braunfels | 50 | 44 | |
| Castroville | 38 | 12 | S.W. Military | 48 | 26 | |
| Culebra Rd. | 50 | 18 | S. Zarzamora | 56 | 29 | |
| S.E. Military Dr. | 50 | 65 | E. Basse Rd. | 125 | 95 |
Create a scatterplot of this dataset by following the directions in Question 1.
Question 1
To create a scatterplot of this data, go to the Relationship Between Two Quantitative Variables tool at https://dcmathpathways.shinyapps.io/Association_Quantitative/.
Step 1) Locate the drop-down menu under Enter Data and select Your Own.
Step 2) Select the box titled Use ID Variable and name the ID Variable and the X and Y-Variables appropriately given the three columns in the data table.
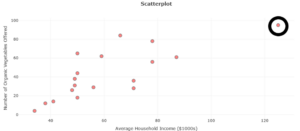
Step 3) Complete the data table appropriately. Then select Submit Data (you may need to scroll down to see it) to create the scatterplot. It should resemble the image of the plot in Question 5 below.
Use the scatterplot you created in Question 1 to answer Questions 2–5.
question 2
What does each dot represent?
question 3
What do the horizontal and vertical axes represent?
question 4
Which store has a greater number of organic vegetables offered: the store located on Marbach Road or the store located on Babcock Road? Describe how you can tell using the scatterplot.
question 5
Which store is represented by the circled dot?
Increasing and Decreasing Trends
Scatterplots are helpful when we want to determine whether a two quantitative variables appear to be related. Each dot on the scatterplot represents the intersection of the two values for a given ID variable. In the data table above, for example, the ID variable is the neighborhood observed and the two quantitative data items collected where neighborhood income and number of organic vegetables available. Did you hover over a dot in the scatterplot your created to see those three pieces of information displayed?
Did the dots in your scatterplot tend to rise up and to the right of the graph? In other words, did it appear true that the higher the average income of a neighborhood was, the greater the number of organic vegetables were available? Keep that idea in mind as you answer Questions 6 – 8.
question 6
Do a quick Internet search. What does it mean for a scatterplot to have an increasing trend? A decreasing trend?
question 7
List one example of an increasing trend and one example of a decreasing trend.
question 8
On your paper, sketch a scatterplot showing an increasing trend and another showing a decreasing trend. To answer this question, you can upload a picture of your sketch or describe it.
You’ve learned to use technology to create a scatterplot and use it to understand the relationship between two quantitative variables in a dataset. You’ve also gained an understanding of increasing and decreasing trends in scatterplots. It’s time now to move on the the course material in this section.
