What you’ll need to Know:
In this support activity you’ll become familiar with the following:
- Recognize when a graph includes a missing component.
In the next preview assignment and in the next class, you will need to identify evidence of five criteria of good graphical displays. Displays that are missing one or more of these criteria can be misleading. In this activity, you’ll prepare to recognize a misleading graph by learning to identify missing or poorly executed display components.
Misleading Graphs
Misleading graphs are sometimes created to intentionally misrepresent the data. This is usually done in order to focus a reader’s attention on a specific trend or pattern. In this corequisite support activity, we will learn about a few different ways a graph can be presented with a missing component or be incorrectly created.
Missing Components
Sometimes, a graph may be created with a missing component that causes a misrepresentation of the data. When the graph is corrected by including the missing piece, a very different perspective usually emerges.
Work with a partner to explore examples of missing display components by answering Questions 1 – 5 .
Question 1
Looking at the following bar graph,[1] at first glance, what seems true about the average house prices between 1998 and 1999?
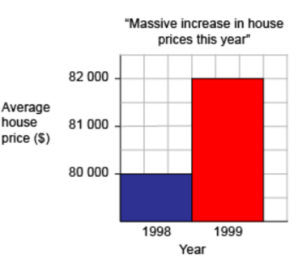
You can see from Question 1 that it is important to always check the scale of a graph before inferring any message that could lead us to misinterpret the data displayed within it. All the data for prices from $0 to $79,000 was missing from the graph in Question 1.
Question 2
Use the following grid to create a sketch of a corrected bar graph for the average house prices for 1998 and 1999. Recall the bar graphs you’ve see previously in the course (such as in the section Displaying Categorical Data in Module 2) for the appropriate value to start the scale of the y-axis.
The graph you drew for average house prices in Question 2 likely presented a much more reasonable picture of the real situation. The graph’s scale should always be checked to see if it communicates misleading information.
example
What key components should be present in a graph?
Other graphs may be missing key elements of a graphical display altogether. See Questions 3 – 5 for an example.
question 4
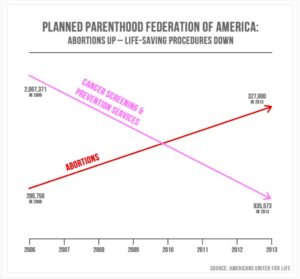
What are some possible implications for how data could be misinterpreted if there is no y-axis on the graph?
question 5
The graph from Question 3 was re-created using the data from Planned Parenthood’s annual reports. The following is the new graph.[3]
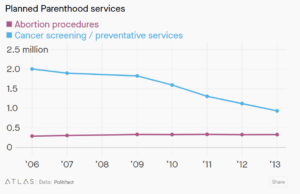
Part A: What missing component was added to the graph?
Part B: Compare the information communicated in the graph in Question 3 to the information communicated in the re-created graph in Question 5.
Color
It is important to use good design principles when using color to communicate information. You’ll learn more about the principles of design specific to graphical displays of data in the course material for this section. For now, see Question 6 for an example of an incorrect use of color in a display.
Question 6
The use of color in a graph can be used inappropriately and can potentially lead to the misinterpretation of a graph. For Parts A and B, refer to the following graph[4] showing information about the number of confirmed cases of coronavirus around the world.
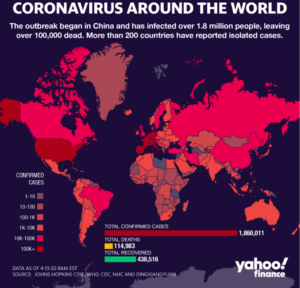
Part A: What do you notice about the colors on the graph?
Part B: Would you change the color palette used for this graph? If so, what colors would you use in the color palette of the legend?
Hopefully, you are starting to understand how graphical displays can be used to deliberately mislead, as well as how an incorrect use of design principles can make it difficult for the audience to understand what information the designer wishes to communicate. Move on to the course section now, where you will learn to identify evidence of key design criteria in graphical displays.
- Top Drawer Teachers. (n.d.). Misleading scales. https://topdrawer.aamt.edu.au/Statistics/Misunderstandings/Misleading-graphs/Misleading-scales ↵
- Collins, K. (2016, March 13). The most misleading charts of 2015, fixed. Quartz. https://qz.com/580859/the-most-misleading-charts-of-2015-fixed/ ↵
- Collins, K. (2016, March 13). The most misleading charts of 2015, fixed. Quartz. https://qz.com/580859/the-most-misleading-charts-of-2015-fixed/ ↵
- McCready, R. (2020, April 17). 5 ways writers use misleading graphs to manipulate you [Infographic]. Venngage. https://venngage.com/blog/misleading-graphs/ ↵
