Objectives for this activity
During this activity, you will:
- Select a simple random sample from a finite population using a random number generator.
- Explain why a sampling method is unbiased or biased.
In What to Know [2A], you learned to identify the population and parameter for a given study. Recall also in Forming Connections [1C], where you learned about the types of variables and how to organize data. In this activity, we’ll extend your understanding of data collection by learning that the method of data collection is as important as what type of data is collected. You’ll gain practice using the terms population, sample, parameter, and statistic in the context of an analysis. You will see that collecting a sample from a population “by eye” will, in general, be a biased sampling method, but that there are methods such as simple random sampling, that are unbiased.
In the preparation page, you took a sample of 10 words from a speech by Justice Sonia Sotomayor. Let’s begin there. Consider Question 1 below on your own, then share your answers with a classmate.
Great Speeches

question 1
What makes a great speech “great?” Is it the speaker’s tone, spacing, intonation, or something involving the words themselves?
How would you collect data on past great speeches to determine what features of these passages make them stand out among other speeches?
In the preview assignment, you read the following excerpt of a speech given by Supreme Court Justice Sonia Sotomayor given at the University of California at Berkley on October 6, 2001.[1]
For me, a very special part of my being Latina is the mucho platos de arroz, gandoles y pernir—rice, beans, and pork—that I have eaten at countless family holidays and special events. My Latina identity also includes, because of my particularly adventurous taste buds, morcilla—pig intestines, patitas de cerdo con garbanzo—pigs’ feet with beans, and la lengua y orejas de cuchifrito—pigs’ tongue and ears. I bet the Mexican-Americans in this room are thinking that Puerto Ricans have unusual food tastes. Some of us, like me, do. Part of my Latina identity is the sound of merengue at all our family parties and the heart-wrenching Spanish love songs that we enjoy. It is the memory of Saturday afternoon at the movies with my aunt and cousins watching Cantinflas, who is not Puerto Rican, but who was an icon Spanish comedian on par with Abbot and Costello of my generation. My Latina soul was nourished as I visited and played at my grandmother’s house with my cousins and extended family. They were my friends as I grew up. Being a Latina child was watching the adults playing dominos on Saturday night and us kids playing loteria, bingo, with my grandmother calling out the numbers which we marked on our cards with chick peas.
Now, does any one of these things make me a Latina? Obviously not because each of our Caribbean and Latin American communities has their own unique food and different traditions at the holidays. I only learned about tacos in college from my Mexican-American roommate. Being a Latina in America also does not mean speaking Spanish. I happen to speak it fairly well. But my brother, only three years younger, like too many of us educated here, barely speaks it. Most of us born and bred here, speak it very poorly.
If I had pursued my career in my undergraduate history major, I would likely provide you with a very academic description of what being a Latino or Latina means. For example, I could define Latinos as those peoples and cultures populated or colonized by Spain who maintained or adopted Spanish or Spanish Creole as their language of communication. You can tell that I have been very well educated. That antiseptic description however, does not really explain the appeal of morcilla—pig’s intestine—to an American-born child. It does not provide an adequate explanation of why individuals like us, many of whom are born in this completely different American culture, still identify so strongly with those communities in which our parents were born and raised.
Guidance
[Intro: To prepare for this activity, you were asked to take a random sample of ten words from an excerpt of a speech given by Justice Sonia Sotomayor in 2001. What method did you use to select your sample? Do you feel that the sample of words your obtained was representative of the population? What makes a sample representative of a population, and are there more than one or two good ways to obtain one? These are the kinds of questions you’ll be asking as you answer Question 2 – 4 in this activity. Work through these questions individually first, then come together in groups to discuss your answers and reach a consensus of what “representative” means.]
Work through Questions 2 – 4 individually, then together with others, reach a consensus of what “representative” means.
Question 2
In Question 3 of the preview assignment, you tried selecting a representative sample of 10 words from this excerpt.
Part A: What is the population of interest that motivates the need for a representative sample?
Part B: Describe your method for selecting this sample.
question 3
Fill in the following table with the words you selected in the preview assignment and the length of each word (number of letters/digits in the word).
| Observation | Word | Length |
| 1 | ||
| 2 | ||
| 3 | ||
| 4 | ||
| 5 | ||
| 6 | ||
| 7 | ||
| 8 | ||
| 9 | ||
| 10 |
question 4
Compute the mean (i.e., average) word length of your sample in Question 3. Is this value a parameter or a statistic?
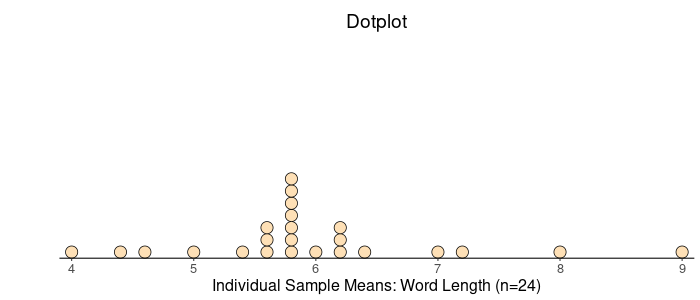
Your instructor may collect your individual sample means and display them in a visualization (a graph) called a dotplot. You’ll study visual displays of quantitative data later in Forming Connections [3C]. You may recall seeing this type of graph in a previous math class.
The horizontal axis contains a range of values from least to greatest that are possible for sample means from the speech excerpt. A dot representing each sample mean in the class is place directly above its corresponding value on the horizontal axis. Here is an example of what the graph might look like for a class of 24 students. Follow your instructor’s directions to answer Questions 5 – 6.
question 5
Your instructor will guide the class in creating a visualization of the results generated by your class. Upload a picture of the plot here. Include a descriptive label for the horizontal axis.
question 6
Based on the plot of sample mean word lengths in Question 5 (or on the example displayed in the text above), how would you describe a typical sample mean? What else do you notice about the “representative” sample means?
Simple Random Sample
Suppose that instead of selecting a representative sample by eye, each student used a random number generator to select a simple random sample of 10 words. A simple random sample relies on a random mechanism to choose a sample, without replacement, from the population so that every sample of size 10 is equally likely to be chosen. “Without replacement” is a common term in probability and statistics that means once an individual from the population is selected for the sample, that individual cannot be replaced and re-selected for the same sample.
To use a random number generator to select a simple random sample, you will need a numbered list of all the words in the population, called a sampling frame. You can then generate 10 random numbers from the numbers 1–431 (the number of words in the population); the chosen random numbers correspond to the chosen words in your sample. The sampling frame for the speech excerpt can be found linked below.
Sampling frame for Justice Sotomayor’s speech excerpt. [link to this here–it is located at the bottom of the DC activity page.]
Work individually to complete Question 7. You’ll find a random number generator app linked in Question 7. Follow the directions given in the question to generate a list of ten random numbers. Then, locate those numbers and their associated words in the sampling frame. Finally, copy those words and their lengths into the table in Question 7.Compute the mean of your sample and record this value in Question 8.
question 7
Use the sampling frame indicated above to complete this question.
Step 1) Go to the Generate Random Numbers tool at https://dcmathpathways.shinyapps.io/RandomNumbers/
Step 2) Select the Random Numbers tab.
Step 3) Under Choose Minimum, type 1 and under Choose Maximum, type 431.
Step 4) Type 10 for how many numbers do you want to generate? and choose no for sample with replacement?
Step 5) Click Generate to select a simple random sample from the population of all 431 words in the excerpt. Fill in the following table with the random numbers selected and each number’s corresponding word and word length (number of letters/digits in the word).
| Observation | Random Number | Word | Length |
| 1 | |||
| 2 | |||
| 3 | |||
| 4 | |||
| 5 | |||
| 6 | |||
| 7 | |||
| 8 | |||
| 9 | |||
| 10 |
question 8
8) Compute the mean (i.e., average) word length in your sample in Question 7. Is this value a parameter or a statistic?
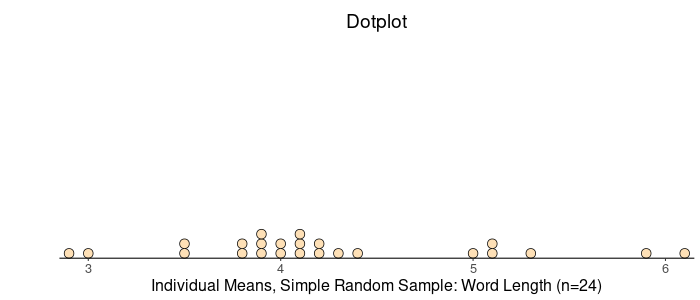
Your instructor may now collect the means you obtained from your simple random samples of word length from the excerpt and display them in a dotplot. Here is an example of what the graph might look like for a class of 24 students. Follow your instructor’s directions to answer Questions 9 – 10. You may work with a partner on these questions.
question 9
9) Your instructor will guide the class in creating a visualization of the results generated by your class using the random number generator. Draw a picture of the plot here. Include a descriptive label for the horizontal axis label.
question 10
The true mean word length of the population of all 431 words in the excerpt is 4.68.
Part A: Is this value a parameter or a statistic?
Part B: Where does this value fall on the plot created in Question 5?
Part C: Where does this value fall on the plot created in Question 9?
Guidance
[Sub-summary: What did you find out about where the true population mean fell in comparison to the dotplot of the first sample means (the ones created “by eye”) and the second graph of means of the simple random samples? Which set of means turned out to be closer to the true population mean? It appears that our collection of samples we thought was random at first, must have tended to overestimate the word length of the excerpt. In Questions11 – 13, you’ll explore why the first set of samples tended to overestimate the true population mean and consider reasons why the simple random samples you collected tended to produce representative samples. It’s that tendency that causes a sampling method to be biased or unbiased: whether or not it tends to produce representative samples. ]
Work in small groups to complete this activity. Compare the two graphs to answer Question 11.
question 11
11) How does the plot generated in Question 9 compare to the plot generated in Question 5? Which features are similar? Which features differ? Why didn’t everyone get the same sample mean?
In Question 12, you’ll use a tool to generate 1,000 sample mean word lengths. The tool is designed to produce samples that are representative of the population of the speech excerpt sampling frame with its mean word length of 4.68.
question 12
12) One set of randomly-generated sample mean word lengths from a single class may not be large enough to visualize the results. Let’s have a computer generate 1,000 sample mean word lengths for us.
Go to the DCMP Sampling Distribution of the Sample Mean (Discrete Population) tool at https://dcmathpathways.shinyapps.io/SampDist_discrete/.
Step 1) Under Select Population Distribution, select Word Length Sotomayor.
Step 2) Then select 10 for the Sample size (n) (you may need to scroll down to display more options) and select 1,00” for the number of samples to simulate drawing from the population. Click Draw Sample(s).
The plot labeled “Sampling Distribution of the Sample Mean” displays the 1,000 randomly-generated sample mean word lengths. How would you describe a typical sample mean?
Question 13
13) Explain why the sampling method of using a random number generator to generate a sample is better than choosing 10 words “by eye.”
Guidance
[Wrap-up: What did you find when you produced 1,000 samples intended to be representative of the population mean? Chances are, your Sampling Distribution of Sample Means showed a high concentration of means near 4.68. That’s because the tool is designed to produce representative samples in a simulation of taking samples using an unbiased method. When we collect a sample from a population, it is important that we do everything in our power to ensure the method we use will have a tendency to produce representative samples.]
- Berkley Law. (2009, May 26). Supreme Court Nominee Sonia Sotomayor’s speech at Berkley Law in 2001. https://www.law.berkeley.edu/article/supreme-court-nominee-sonia-sotomayors-speech-at-berkeley-law-in-2001/ ↵
