objectives for this activity
During this activity, you will:
- Use a data analysis tool to describe variability of data.
- Find and interpret the standard deviation of data.
Click on a skill above to jump to its location in this activity.
It’s Showtime!
When it comes to movies, have you ever sat down and thought about how long or how short some movies are? Have you thought about why there is such variability in the length of movies?

In this activity we’ll explore movie lengths or “runtimes” and the ratings that go along with the runtimes. Let’s compare the movie runtimes for rated G (General Audiences, All Ages Admitted) and rated R (Restricted, Children Under 17 Require Accompanying Parent or Adult Guardian) movies.[1] Along the way, you’ll gain an understanding of how variability is reflected in graphical displays and described using numerical summaries.
Before beginning, consider the following question.
question 1
Do you think the rating (G versus R) of a movie has anything to do with how long the movie is?
video placement
[guidance: This activity will rely heavily on the tool, and it’s a quick activity. The intro can be more focused on the dataset itself, to get students interested. Remind students of the three variability measures: std dev (use the tool), variance (remember to square the std dev by hand), range (remember to calculate this from min and max given in the tool).]
Using Technology to Describe Variability
Let’s use a dataset of movie runtimes to explore variability using technology.
Go to the Describing and Exploring Quantitative Variables tool at https://dcmathpathways.shinyapps.io/EDA_quantitative/.
Step 1) Select the Several Groups tab.
Step 2) Locate the drop-down menu under Enter Data and select From Textbook.
Step 3) Locate the drop-down menu under Dataset and select Movie Run Time.
question 2
Find the mean ([latex]\bar{x}[/latex]), median, standard deviation ([latex]s[/latex]), and variance ([latex]s^{2}[/latex]) for the runtimes for both the G-rated and R-rated movies and record them in the table below.
| Rating |
Mean ([latex]\bar{x}[/latex]) |
Median |
Standard Deviation ([latex]s[/latex]) |
Variance ([latex]s^{2}[/latex]) |
| G | ||||
| R |
question 3
Create a dotplot or histogram of the data, whichever you choose. Compare the numerical value of the standard deviation to the spread that is shown in the graphical representation for each rating.
question 4
What else do you see in the distributions of runtime that might affect the variability?
Finding and Interpreting Standard Deviation
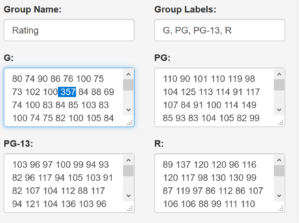
Let’s explore the impact of the outlier on the variability of the G-rated movies. In the G-rated group, select and remove the outlier of 357. As illustrated in the following screenshot, highlight the value 357 and delete.
question 5
Find the mean ([latex]\bar{x}[/latex]), median, standard deviation (s), and variance (s2) for the G rating with and without the outlier and then record them in the table below. Refer to the preview activity if you need help remembering how to calculate variance. Enter your answers from Question 2 again in the table below to ease the comparisons.
| Rating | Mean
([latex]\bar{x}[/latex]) |
Median | Standard Deviation
(s) |
Variance
(s2) |
| G rating with the outlier | ||||
| G rating without the outlier |
question 6
What do you notice about the effect of an outlier on standard deviation?
question 7
Do you think standard deviation represents a “typical” distance from the mean when an outlier is present?
video placement
[wrap-up: The goal is for students to understand that standard deviation is sensitive to outliers and is not a perfect measure of variability. “What did you think about how sensitive std dev is to the presence of outliers? How did the dot in the G-rated distribution affect the numerical summary? Let’s examine the range of the G-rated distribution. Note that the max value is 357, but the data is clearly concentrated between about 70 and120. Let’s look again at what happens to the mean of the distribution when we remove the outlier. The median stays about the same, which makes sense since it’s the middle data value. But the mean drops from a position well to the right of the median back to even with the median. And the variance drops from about 625 to about 121 — pretty significant! The key take-away is that our ideas of center and spread are affected greatly by the presence of outliers, and they should be used responsibly. Standard Deviation can give us an idea of variability, along with other characteristic about a distribution, but it is not a perfect measure. ]
- What do movie ratings mean? (n.d.). Showbiz.Junkies. Retrieved from https://www.showbizjunkies.com/mpaa-ratings/ ↵
